Technical Analysis: EUR/USD and S&P 500

This post will focus solely on technical analysis of currencies and indices.


EUR/USD (Bearish)
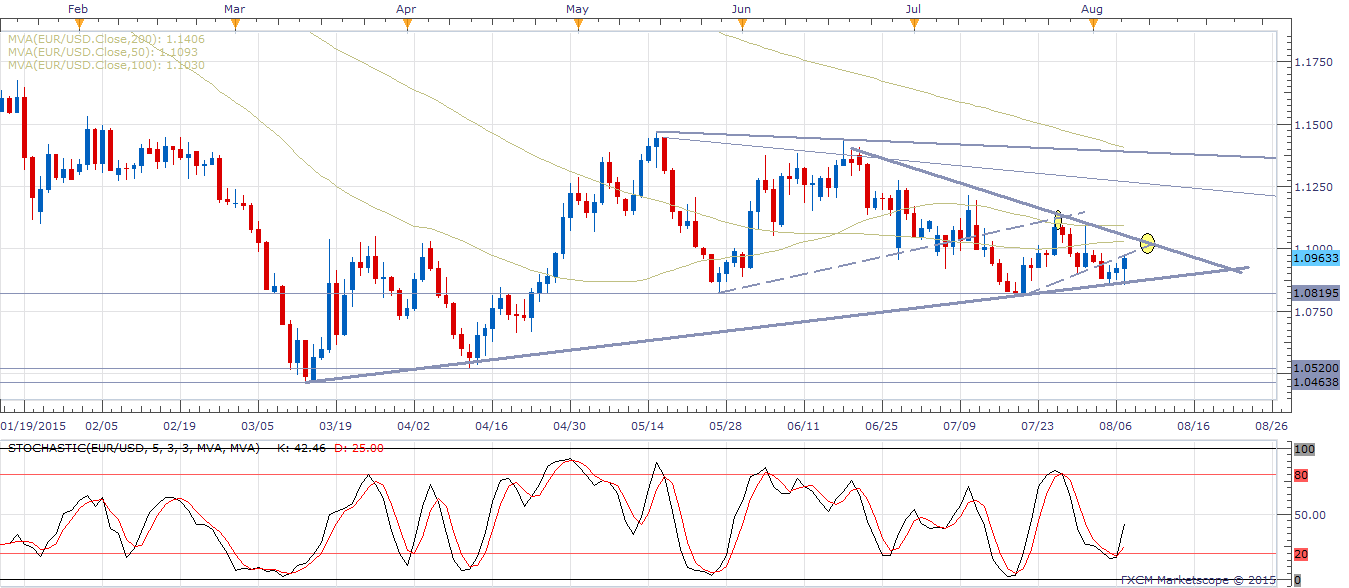
EUR/USD - Daily
EUR/USD – Daily

As you can see on the “Daily” chart, Symmetrical Triangle or contracting wedge (both very similar) has been formed. The trading range is contracting, not far away from breakout. You see the small yellow circle (around 1.1020) that EUR/USD is approaching? That’s where I would short EUR/USD. That’s the place where there are trend resistances, and Simple Moving Average (SMA) of 50 and 100 are approaching. Not only that, but Stochastic indicator should get close to 80 (overbought), as EUR/USD goes to that yellow circle. Let’s take a look at 4H (4-Hour) chart.
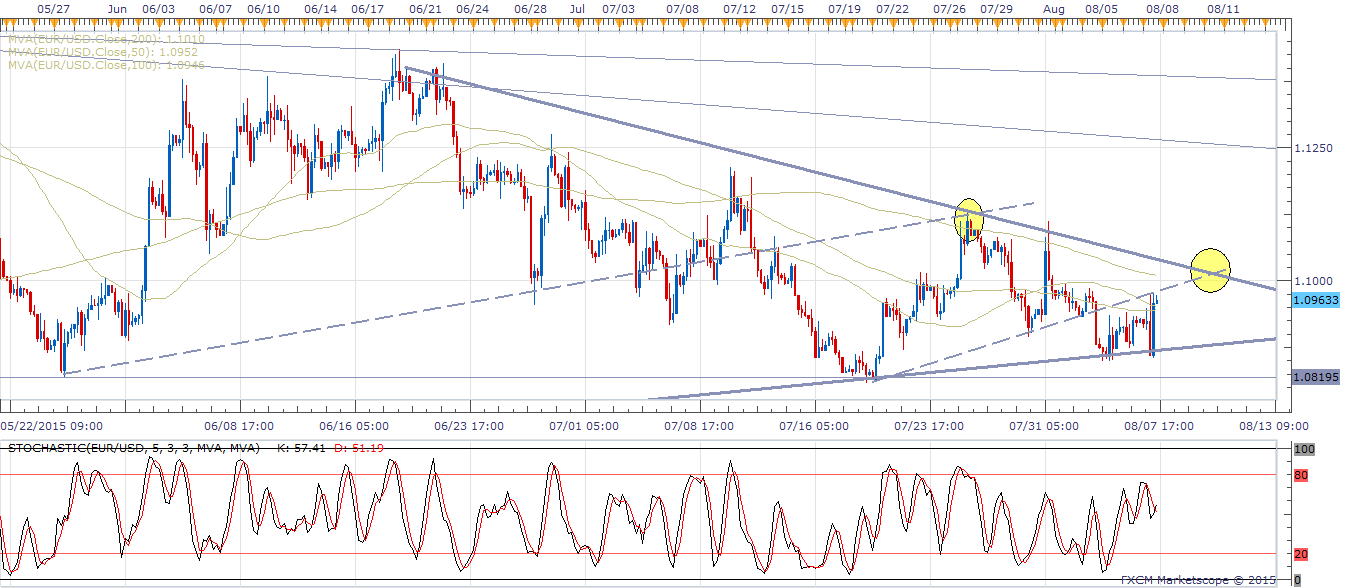
EUR/USD - 4H (4 Hour) Chart
EUR/USD – 4H (4 Hour) Chart

The first yellow circle you see on the “4H” chart was a sell single because support-turned-resistance at a rising trend line. Same thing is happening right now to EUR/USD, as it approaches the second yellow circle (around 1.1020).

The reason I’m shorting it in the tightening consolidation before the breakout is because there are many technical reasons to short it. Even if it goes opposite direction, my loss will be very limited (Just above the trend – around 1.1030)

Let’s take a look at 1H (1-Hour) chart.
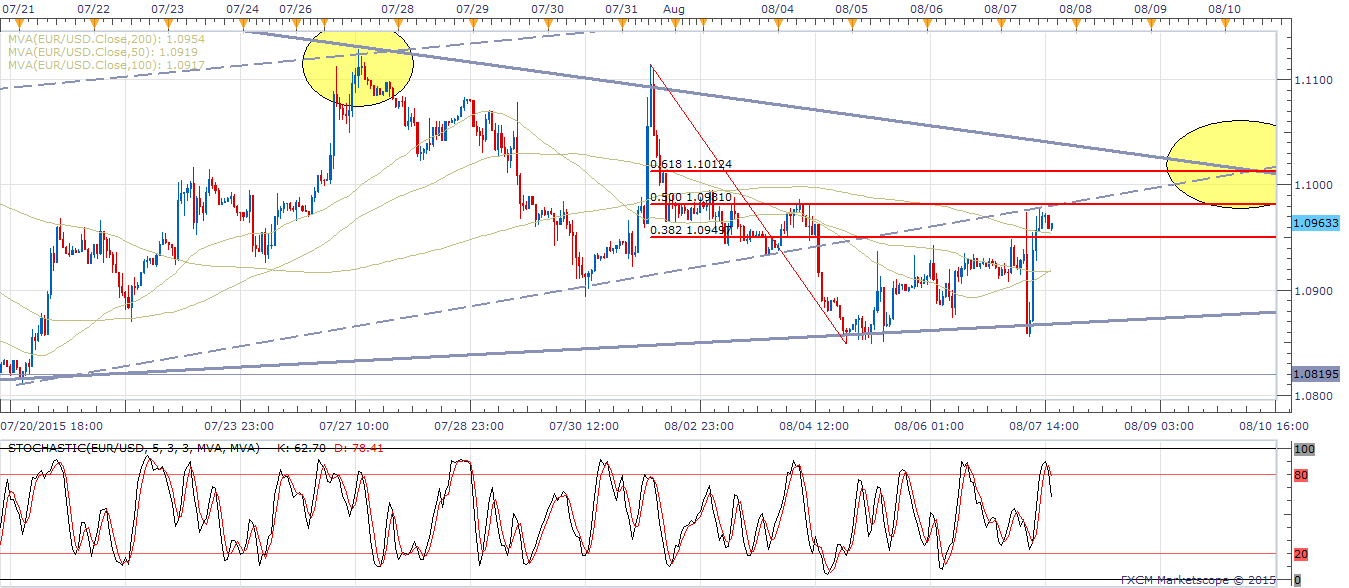
EUR/USD - 1H (1 Hourly) Chart
EUR/USD – 1H (1 Hour) Chart

On 1H chart, I added Fibonacci Retracements indicator. Fibonacci Retracements basically act as support and resistance lines. The red lines you see on “1H” chart, are resistance lines. 61.8% level (or 0.618%) at 1.1012 is known as “golden ratio”. In my past expensive, 61.8% level has worked well. Plus, 61.8% level connects with the two trend lines in the yellow circle.

I would short EUR/USD as it approaches the middle of  the second yellow circle (around 1.1015). Stop loss: 1.1030 (just above the trends lines and golden ratio (0.618%) level. Target: 1.0890 (just above the support trend as seen in the charts above). My target level (1.890) will change as time goes on, to stay in-line with the support trend.


S&P 500 (Bullish)

Let’s take at look “Weekly” chart, going back as far as 2008.
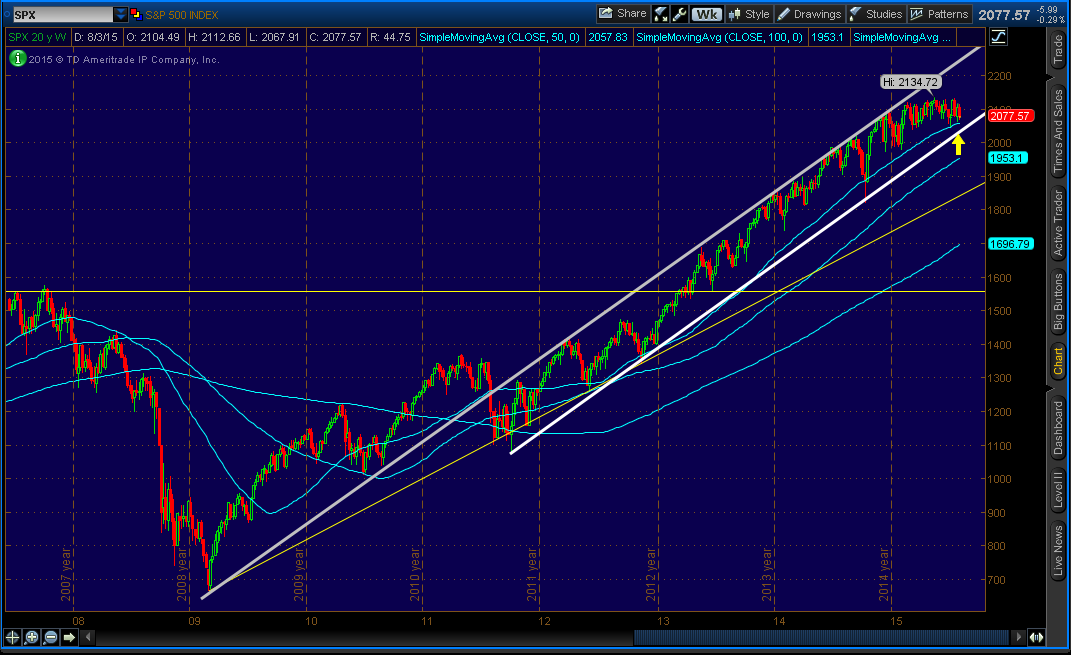
S&P 500 - Monthly
S&P 500 – Monthly

As you can in the “Weekly” chart, ever since hitting bottom in early 2009, S&P 500 have been in a uptrend. If you look at the white-line, there’s a long channel (you can call it a trend if you want). Current price is just above the 50 SMA (Simple Moving Average). Plus, it’s much closer to the support line of the channel.

Let’s take a look at two “Daily” charts.
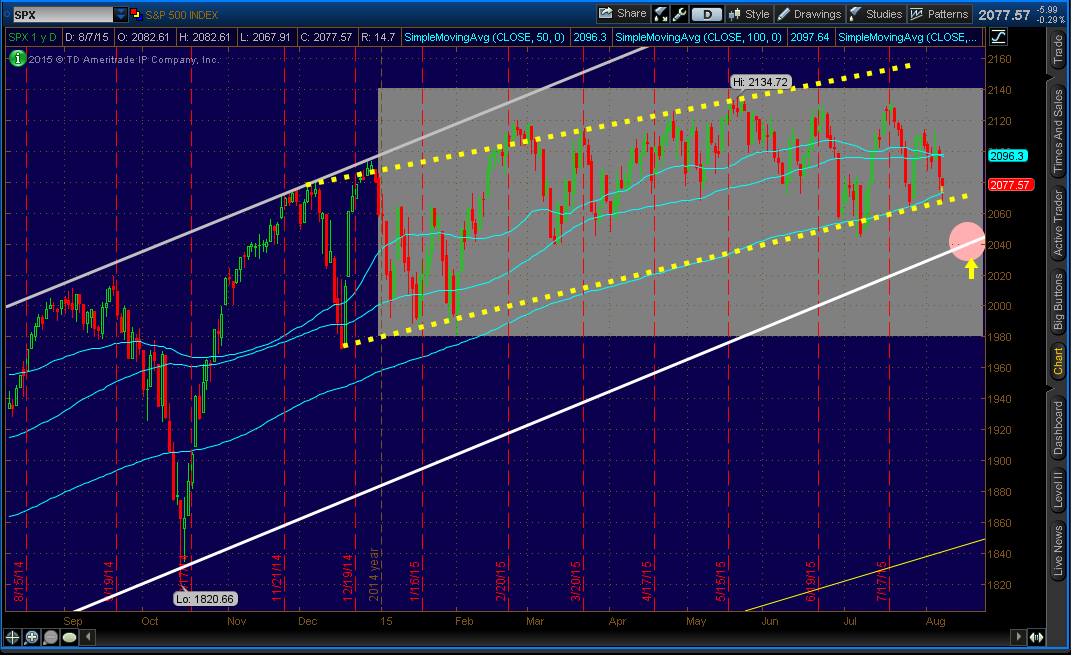
S&P 500 - Daily
S&P 500 – Daily
S&P 500 - Daily
S&P 500 – Daily

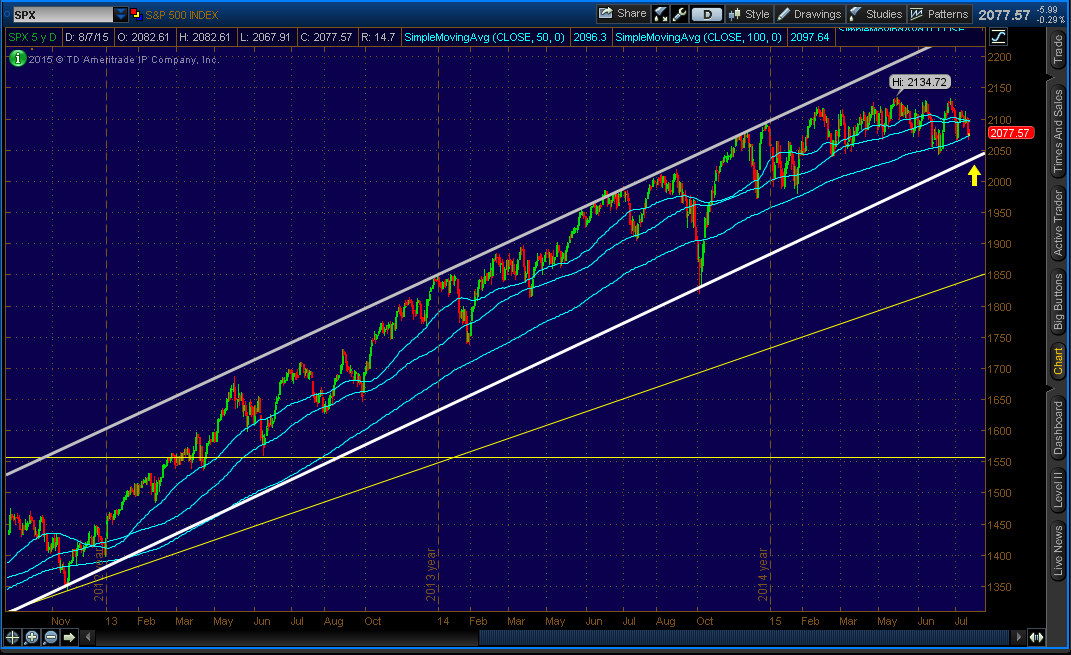
If you look at any of the two “Daily” charts, you can see that the current price is sitting on 200 SMA and on recent-uptrend support (yellow dotted line). Even though it’s a strong signal to go long, I would not. The reason is that it is a 3rd time in over a month that the price is sitting on 200 SMA and uptrend support (yellow dotted line) , and the recent highs in the uptrend range were unable to reach the trend resistance as well break the previous high. It shows that the bulls are losing control and bears are slowly gaining momentum.

Where I would go long is at the circle shown with yellow arrow (around 2042). It’s just above the strong channel (or a trend) support line (Bold-white line) as shown in all three S&P 500 charts above. My stop loss would be just below the bold-white line. My target would be at the resistance level of 2134.

If you have any questions, feel free to leave your questions in the comments section, and/or contact me. Thank you.

Canada Crisis: Second Rate-Cut Of The Year

On July 15 (Wednesday), Canada’s central bank AKA Bank of Canada (BoC) cut overnight rate by 25 basis points (bps) from 0.75% to 50%. This is the second rate-cut this year. First rate-cut took place in January. Not only rate-cut, but lower growth forecasts.

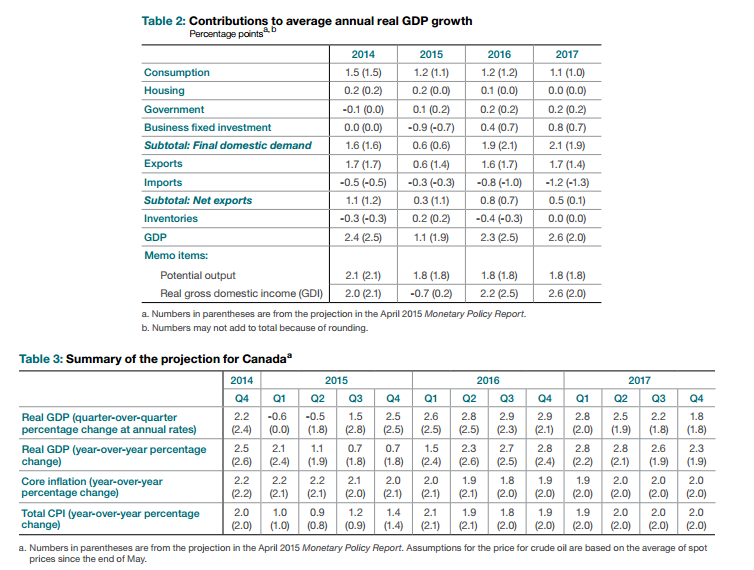
BoC expects Gross Domestic Product growth to be 1.1% year-over-year (Y/Y) this year, down from its 1.9% forecast in April. Policy makers said that Gross domestic product probably “contracted modestly” in the first half. However, they did not call it recession. ‘‘The lower outlook for Canadian growth has increased the downside risks to inflation,’’ policy makers said.

Bank also reduced the net exports contribution to GDP by 0.8% to 0.6% from 1.4%. A stronger U.S. economy and a weaker Canadian dollar should contribute to higher export growth.

Bank of Canada's July Forecasts. Source.
Bank of Canada’s July Forecasts (Page 14). Source.

There has been a big shift in the inflation tone over the past few months:

April: “Risks to the outlook for inflation are now roughly balanced”

May: “the Bank’s assessment of risks to the inflation profile has not materially changed”

This time (July): “The lower outlook for Canadian growth has increased the downside risks to inflation”

“The Bank anticipates that the economy will return to full capacity and inflation to 2 per cent on a sustained basis in the first half of 2017.” In the April’s forecasts, the bank expected the economy to return to full capacity at the end of 2016. I can tell that the Bank is running scared.

Damages from low oil prices has been extensive.  Canada is the world’s fifth-largest oil producer and lower oil prices will definitely not help the economy. The damages from lower oil prices shrank the economy in the first half of the year.

Recently after Iran deal has been reached, oil prices fell sharply. It’s currently trading around $48. If the the deal is finalized, it won’t be very good for Canada economy since Iran might want to double its oil production, leading to much lower oil prices.

The bank also said “Additional monetary stimulus is required at this time to help return the economy to full capacity and inflation sustainably to target.” If conditions get worse, they will cut rates again.

Oil is not the only problem for Canada. Other concerns are potential bubbles in housing and consumer debt.

According to BoC’s Monetary Policy Report (June), “the vulnerability associated with household indebtedness remains important and is expected to edge higher in the near term in response to the ongoing negative impact on incomes from the sharp decline in oil prices and a projected increase in the level of household debt.” (Page 30).

Over the past few years, housing prices in Canada have skyrocketed. Lower borrowing costs will just add fuel to the fire (DEBT + HIGH PRICES IN HOUSING MARKET WITH LOW INTEREST RATES = NOT A GOOD COMBINATION) . There just might be a bubble in the housing market. But, BoC does not think so.

The next BoC meeting is on September 9th, about a week before the U.S. Federal Reserve meeting, the day that many believe lift-off from the zero interest rate policy will take place. CPI and non-farm payrolls data for July and August will decide whatever the Fed will hike or not.

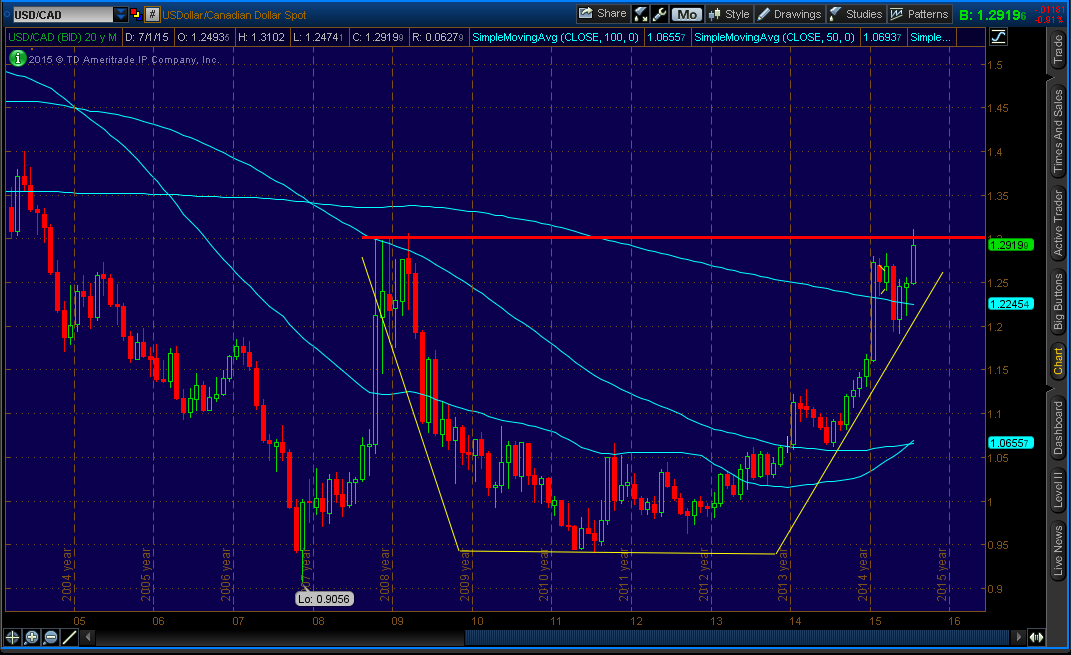
Rate-cuts and plunging commodity prices, especially crude oil, has caused sell-off in Loonie. Ever since the first rate-cut of the year (January), Loonie (CAD) has weakened significantly. With strengthening dollar (USD), USD/CAD has skyrocketed. When looked at monthly chart, USD/CAD has developed ‘Cup and Handle’ formation. While this is a sign to short USD/CAD, I would be very careful because fundamentals for CAD are too weak. If I were to short it, I would put my stop above the resistance line (Bold Red line).

USD/CAD - Monthly
USD/CAD – Monthly


The Fed On Hold…For Now

Last Wednesday (June 17, 2015), Federal Reserve released high anticipated FOMC statement, FOMC Economic Projections, and of course the Federal Funds Rate (interest rate). Federal Open Market Committee (FOMC) kept the interest rates on hold while they decreased their rate projections for 2016 and 2017.

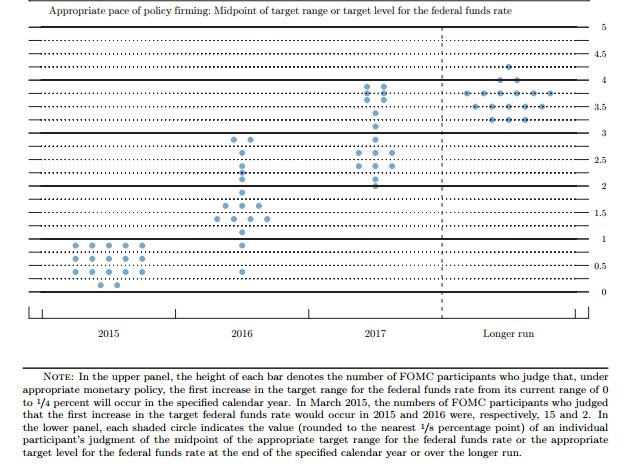
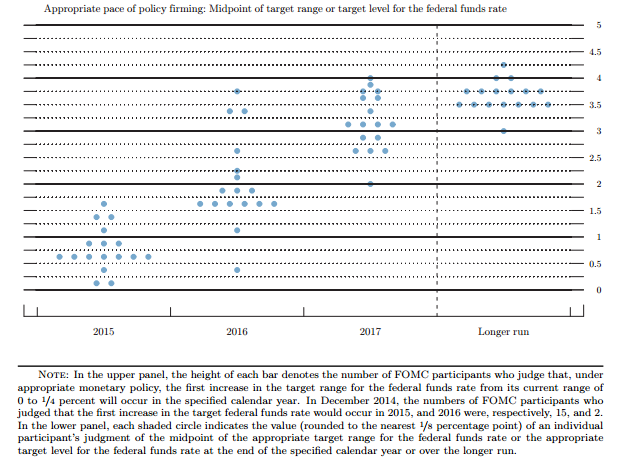
The projections, or “dot plot”, which shows where FOMC members expect interest rates in the future, suggest that there will be one, or two quarter percentage (%) point interest rate increase by the end of the year. In March, the projections suggested more than two quarter percentage increases. That was before they knew that the first quarter of 2015 dragged on the economy…temporarily. 15 of 17 FOMC members believe that the first rate-hike will take place this year, same as March’s projections. Five officials foresee one increase in the rates this year by quarter percentage point, up from 1 official in March. Another five officials foresee 0.50% increase this year, down from seven officials in March. Two officials wants to keep rates unchanged this year. In March, officials did not know if the first quarter slump was temporary or not. They just believed negative economic news were due to “transitory effects” which includes West Port strike, low energy prices, bad weather, and  stronger dollar. Now that we been seeing more positive economic news, many officials believe first quarter slump was temporary.

Officials reduced their median estimate for the federal funds rate by the end of 2016 to 1.625% from 1.875% in March, and to 2.875% by the end of 2017, down from 3.125% in March.

FOMC Economic Projections
FOMC Economic Projections – June 2015 —– Source: Federal Reserve
FOMC Economic Projections - March 2015 ----- Source: Federal Reserve
FOMC Economic Projections – March 2015 —– Source: Federal Reserve

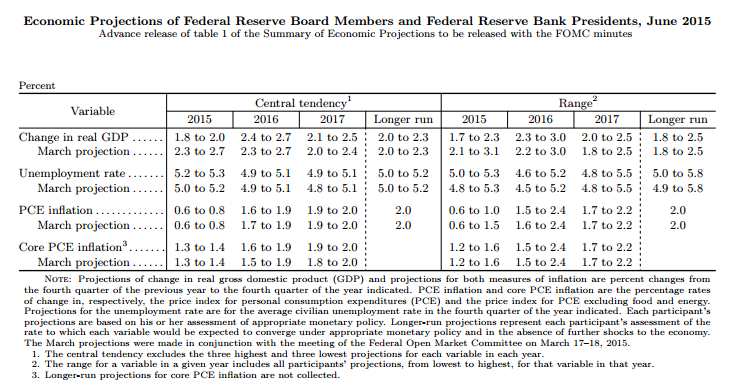
The Fed lowered their economic projections for 2015. They see economic output growth to 1.8% to 2.0%, from 2.3% to 2.7% in March. For 2016, it is seen growing by 2.4% to 2.7%, from 2.3% to 2.7% in March. For 2017, it is seen growing by 2.1% to 2.5%, from 2.0% to 2.4% in March. For 2016 and 2017, it’s essentially the same forecasts. They also changed their forecasts slightly for unemployment rate and inflation.

FOMC Economic Projections - June 2015 ----- Source: Federal Reserve
FOMC Economic Projections – June 2015 —– Source: Federal Reserve

In the statement, Fed policy makers reiterated that they must see “further improvement in the labor market” and be “reasonable confident that inflation will move back to its 2 percent objective over the medium term”. If the labor market continues to improve like they did in May, and inflation continues to improve, I strongly believe we will see rate-hike in July or September. It’s likely to be September because there will be no press conference in July. If the federal funds rate is increased in July, there will so much uncertainty and volatility in the markets because the Fed will not have a chance to explain their actions. However, there still might be rate-hike in July because the Fed wouldn’t want to increase rates too late.

During the press conference, Yellen said “…we have seen some progress. Even so, the Committee judged that economic conditions do not yet warrant an increase in the federal funds rate. While the Committee views the disappointing economic performance in the first quarter as largely transitory, my colleagues and I would like to see more decisive evidence that a moderate pace of economic growth will be sustained, so that conditions in the labor market will continue to improve and inflation will move back to 2 percent.” It shows that the Fed is not confident enough to raise the rates yet. She said that the policy will be “data dependent”. I believe future US economic reports will be positive until December when we might get unfavorable weather again. Bad weather always derails the Fed’s view on the policy because it affects majority of country.

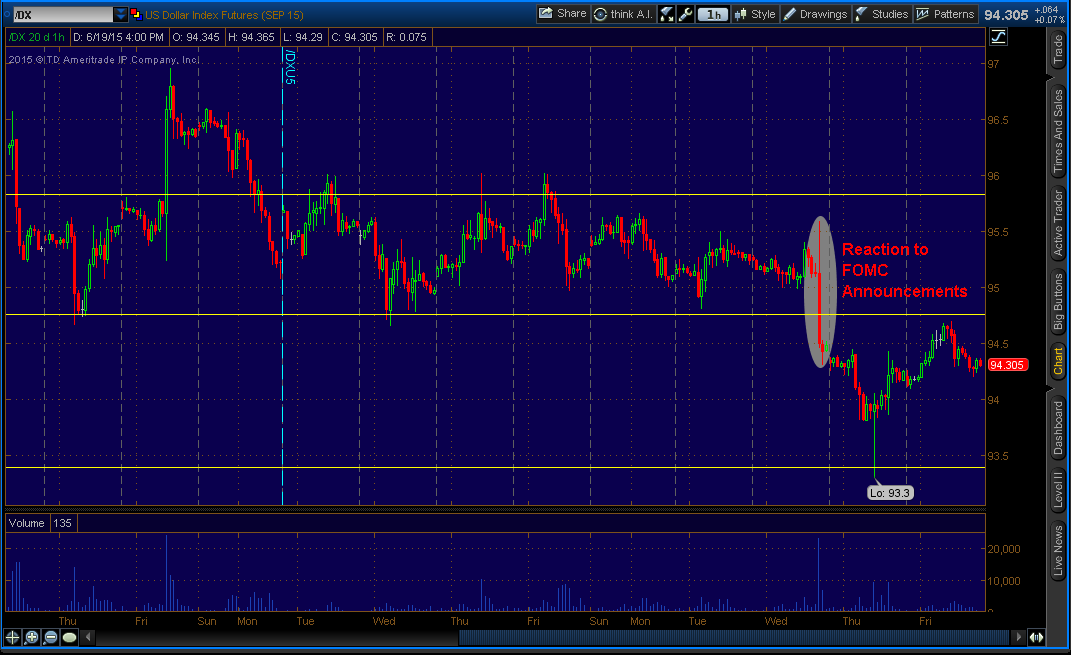
Regarding the US Dollar, or Greenback, Yellen said that the dollar “appears to have largely stabilized” and its significant appreciation is going to continue to drag on the economy for some time to come. The dollar has risen more than 15% against major currencies over the last 12 months.

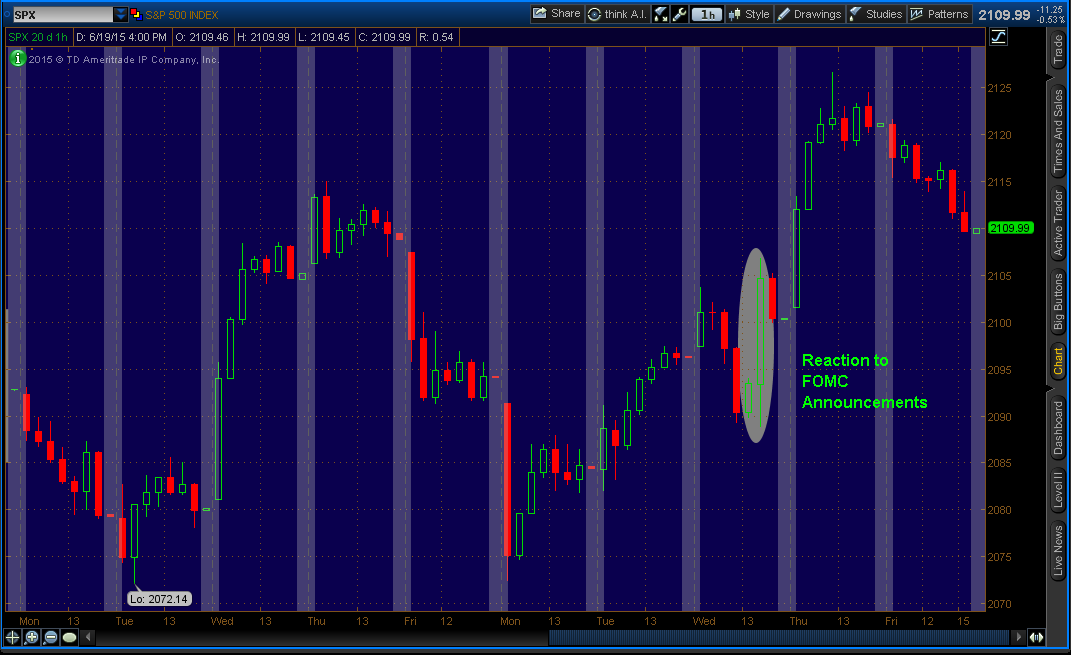
US markets rose after the Fed announcements while the greenback (US Dollar) slipped. US markets continued to rise the next day.

Standard & Poor 500 ( "SPX" on ThinkorSwim platform) - Hourly
Standard & Poor 500 ( “SPX” on ThinkorSwim platform) – Hourly
US Dollar ( "/DX" on ThinkorSwim platform) - Hourly
US Dollar ( “/DX” on ThinkorSwim platform) – Hourly