U.S. Rate-Hike Impending – Tick Tock

Last Thursday (July 30, 2015), the Bureau of Economic Analysis (BEA) released its advance (1st estimate out of 3) of Gross Domestic Product (GDP) for the second quarter (April, May and June) of the year. It was positive enough to increase the chance of rate-hike in September significantly.


Before we go any further, let’s review what two types of GDP, nominal-dollar terms and real-dollar terms. Current (or nominal-dollar) GDP tallis the value of all goods and services produced in the U.S. using present prices. On the other hand, Real (or chained-dollar) GDP counts only the value of what was physically produced. To clarify the point, suppose a hat-making factory announces that it made $1 million selling hats this year, 11% more than last year. The $1 million represents nominal company sales (or current dollar). However, something is missing. From this future alone, it’s unclear how the factory achieved the extra income. Did it actually sell 11% more hats? Or did it sell the same number of hats as the year before but simply raised prices by 11%? If the factory made more money because it increased the price tag by 11%, then in real (constant-dollar) terms, the true volume of hats sold this year was no greater than last year, at $900,000.

It’s vital to know if the economy grew because the quantity of products sold was greater or whether it was largely the result of price hikes, or inflation. (Source: “The Secrets of Economic Indicators” by Bernard Baumohl)


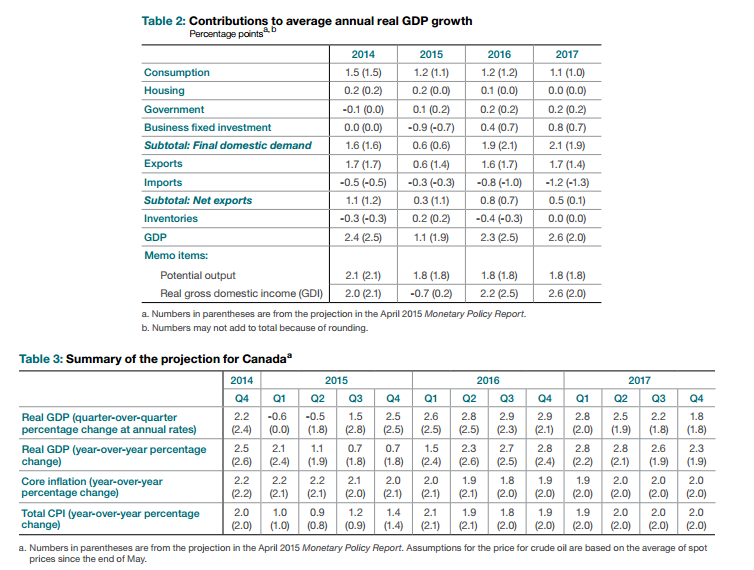
Real GDP increased at a annualized rate of 2.3%, vs expectations of 2.5%.  This is a major acceleration from the first quarter when real GDP increased 0.6% (expansion), revised from -0.2% (contraction). The economy bounced back after a slow start in the beginning of the year.

Real GDP - Quarterly (1Q 2011-2Q 2015)
Real GDP – Quarterly (1Q 2011-2Q 2015)

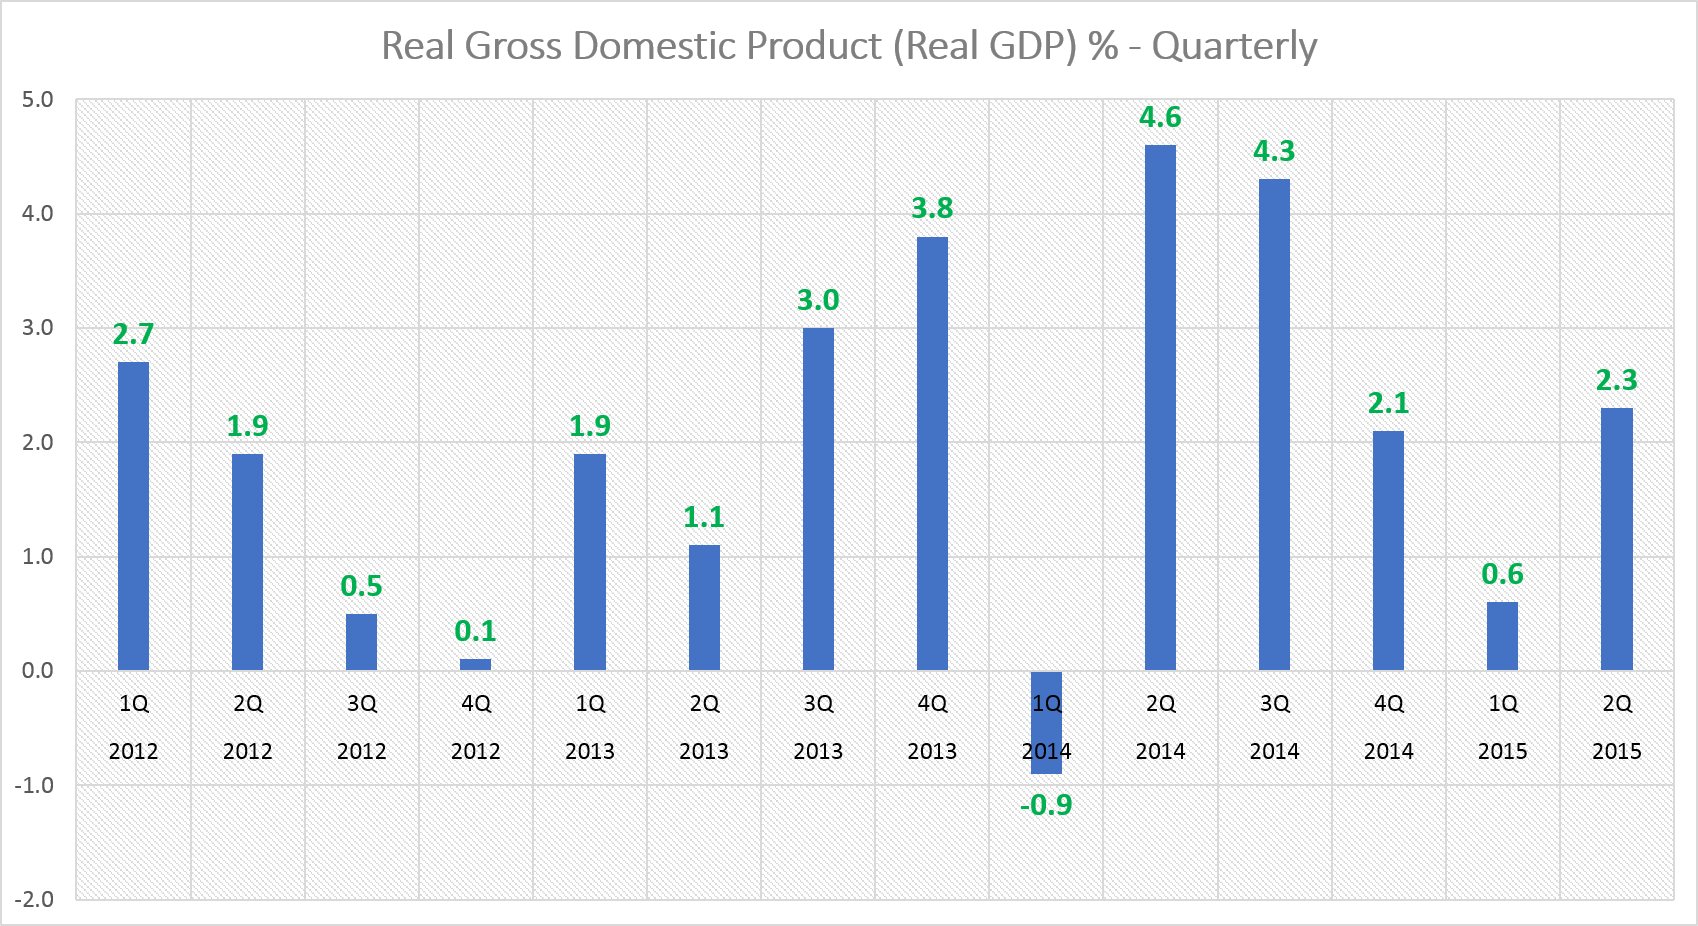
In the beginning of the year, US economy was hurt, or “walked backwards” due to unfavorable weather, lower energy prices, West Port strike, and stronger dollar. While, the economy has moved beyond the weather and west port strike, – a strong dollar, and lower energy prices will continue to limit growth.

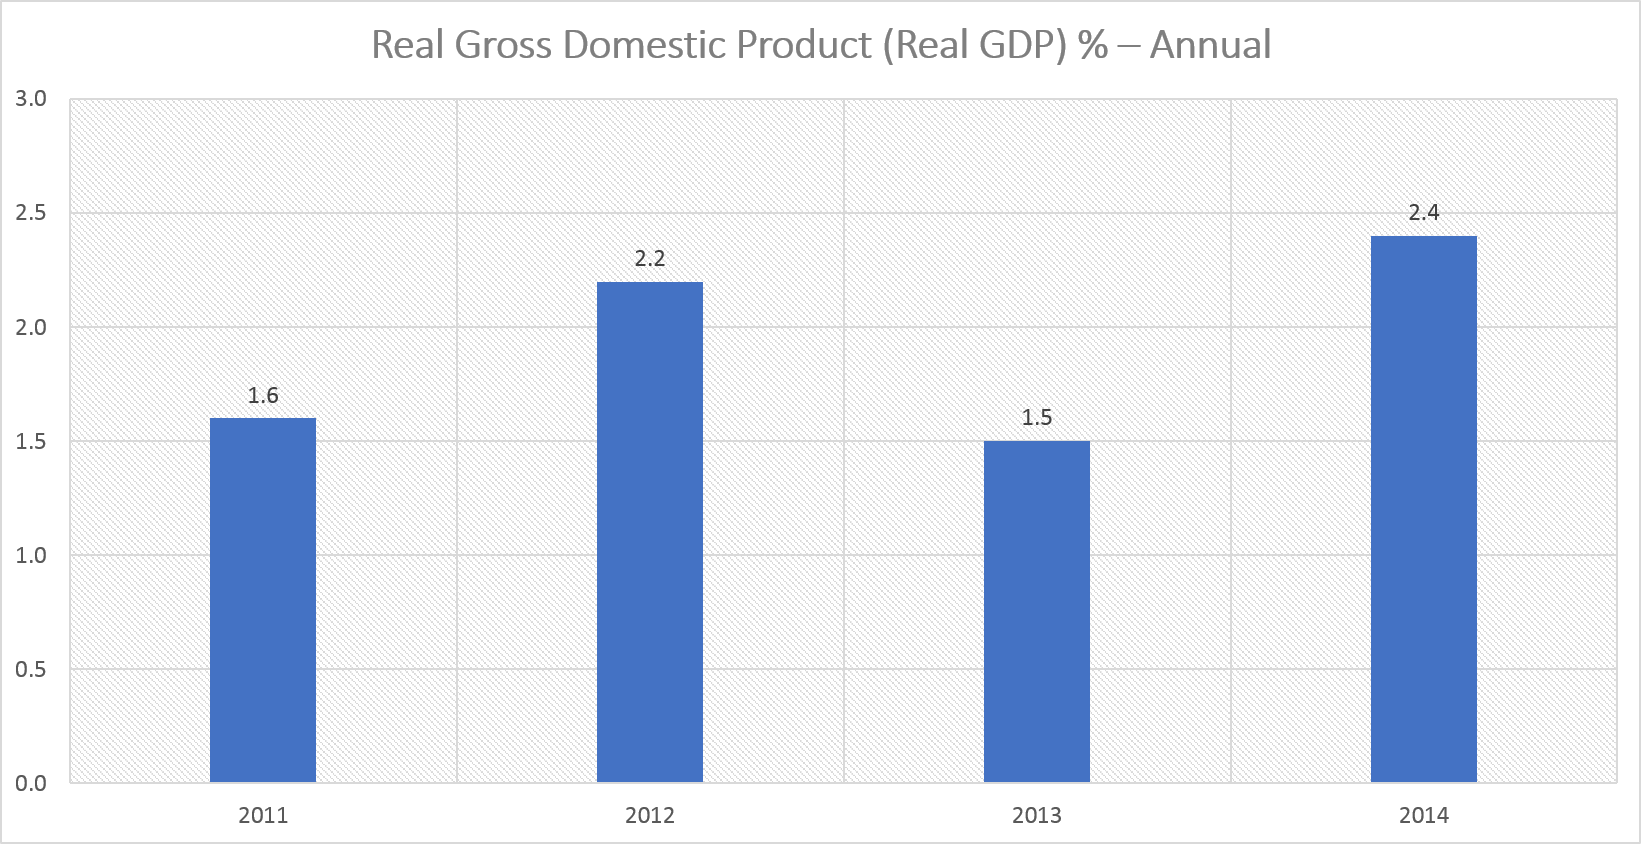
While first quarter was revised upwards, 2011-2014 was revised lower. The economy grew 1.6% in 2011, down from the 2.3% initial reading; 2.2% in 2012, up from the 1.5% initial reading; 1.5% in 2013, down from 1.7%; and 2.4% in 2014, down from 2.7%. From 2011 to 2014, growth was essentially weaker. The economy expanded by an average annual rate of 2%, below initial reading of 2.3%.

Real GDP - Annual (2011-2014)
Real GDP – Annual (2011-2014)

Growth in the second quarter was boosted by consumer spending. Consumer spending grew at a 2.9% rate from a 1.8% in the first quarter. That is a very good sign because real personal consumption expenditures (PFE) AKA consumer spending, accounts for 70% of total GDP. If people are not spending, it spells serious trouble for the economy.

Real exports increased 5.3% in the second quarter, compared to 6% fall in the first quarter. First quarter’s significant drop was due to west port slowdown. The strong dollar has hurt exports but its effects have eased recently…for now. Port delays in the first quarter freed up exports and temporarily increased exports.

Business investment fell 0.6% in the second quarter, from previous 1.6% increase in the first quarter, as energy companies continue to scale back projects amid low oil prices.

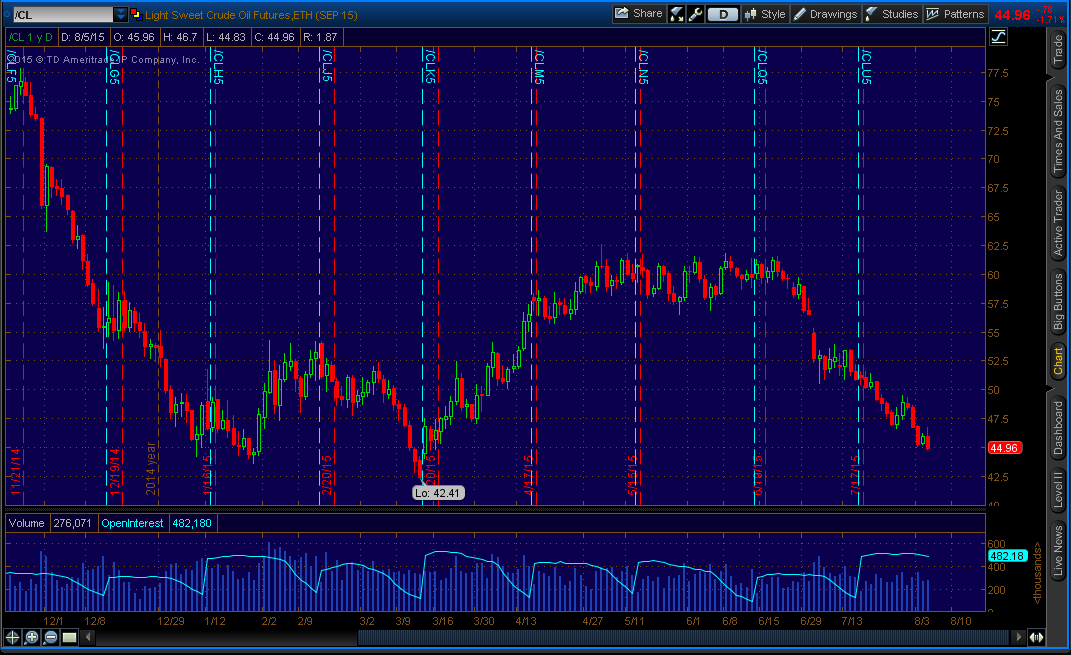
Recently, crude oil prices have fallen back to the Earth. On Monday, August 3, crude oil prices hit just above $45 (currently below $45). It will continue to hurt energy companies, causing them to scale back projects and lay-offs. Low gasoline prices, however, would lead consumers to spend money. It’s better to pay off debts first before spending money on “wants”.

Crude Oil ("/CL" on thinkorswim) - Daily
Crude Oil (“/CL” on thinkorswim) – Daily

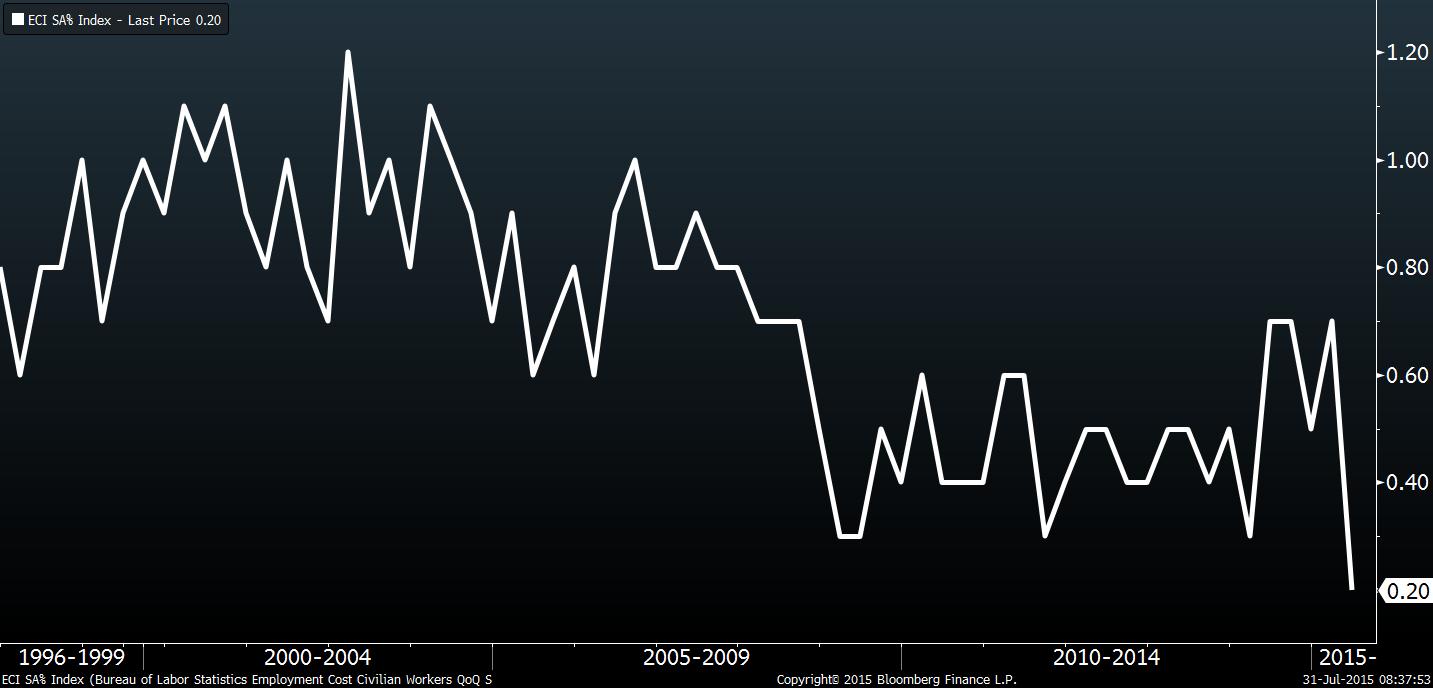
On Friday (July 31, 2015), Employment Cost Index (ECI) report for the second quarter was released and it was disappointing.

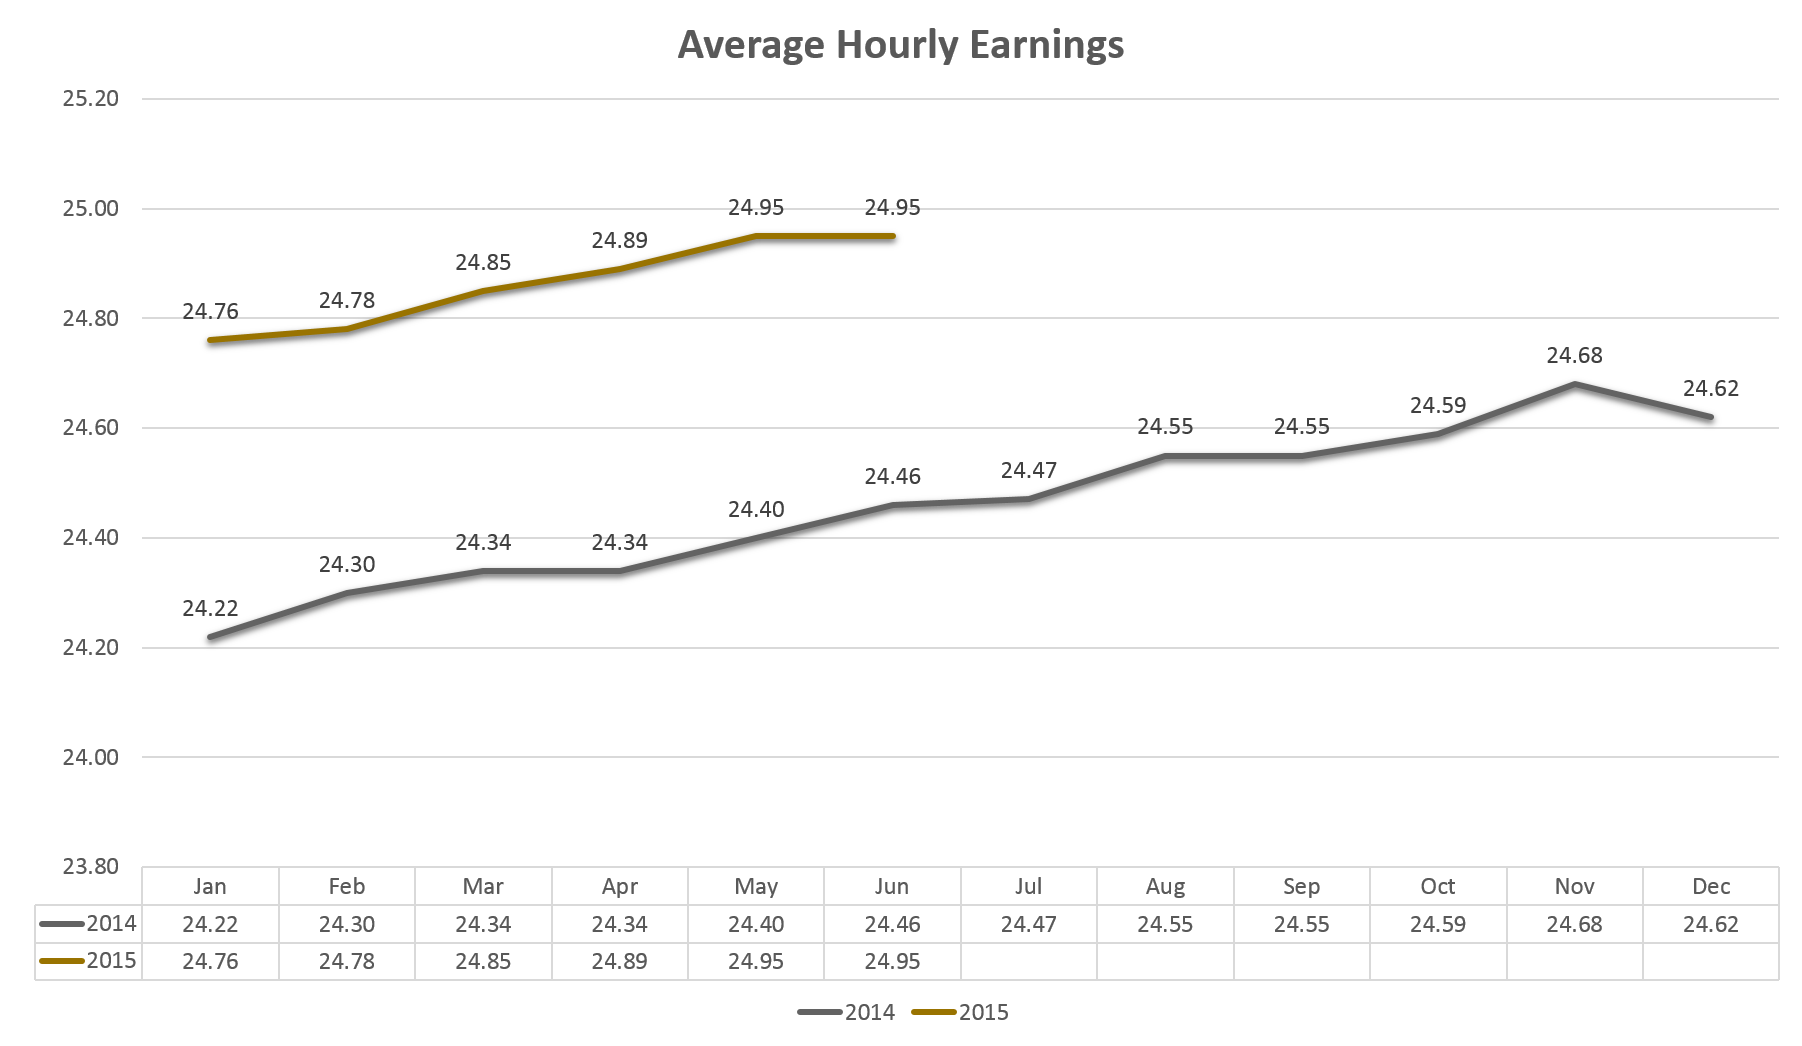
ECI, a broad measure of workers’ wages and benefits, increased 0.2%, smallest gain since records began in the second quarter of 1982, following 0.7% increase in the first quarter. Wages and salaries, which accounts of 70% of compensation costs, also increased 0.2% in the second quarter, the smallest gain on record.

Employment Cost Index (ECI) - Bloomberg Terminal
Employment Cost Index (ECI) – Bloomberg Terminal

The report suggests that slack remains in the labor market.  The unemployment rate fell to 5.3% in June – the lowest level since April 2008 – close to the Fed’s target of 5% to 5.2%, which the Fed policy makers consider consistent full employment.

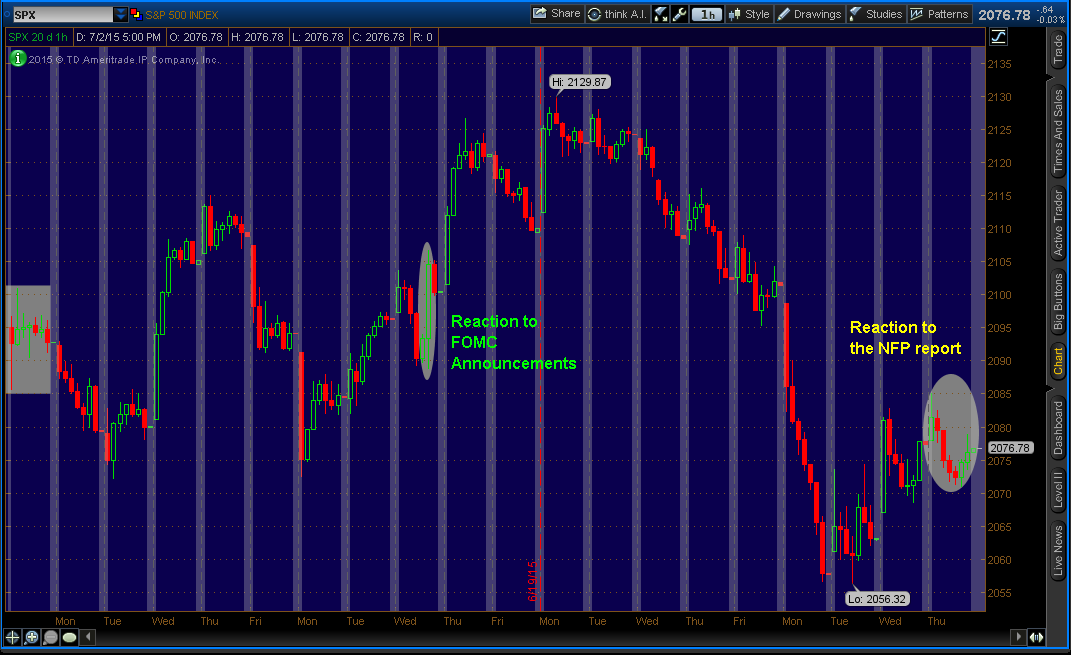
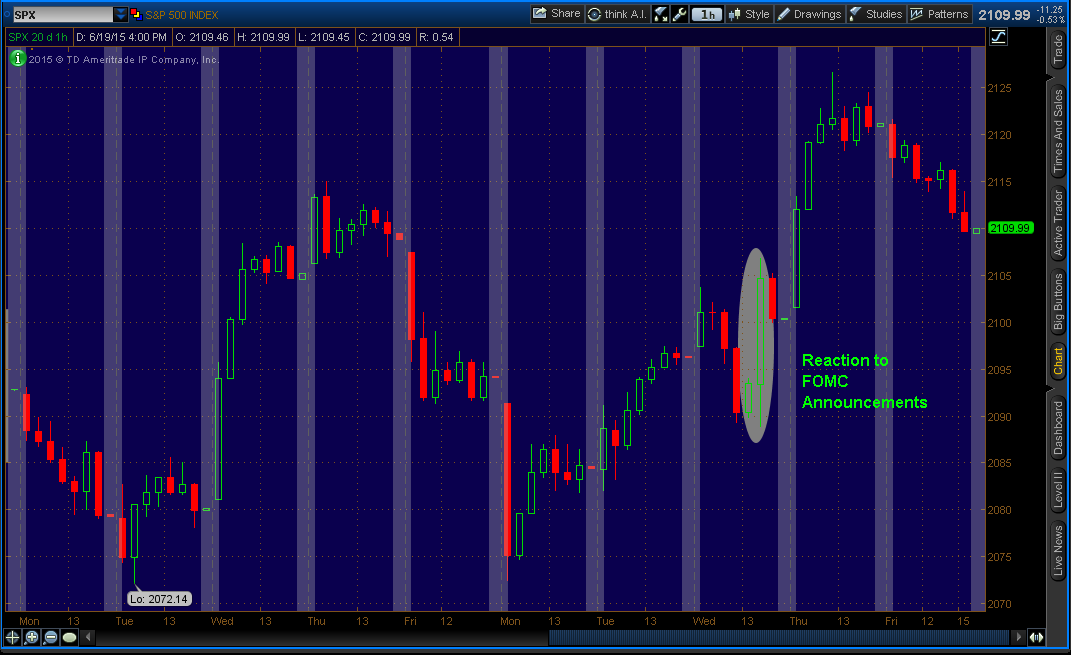
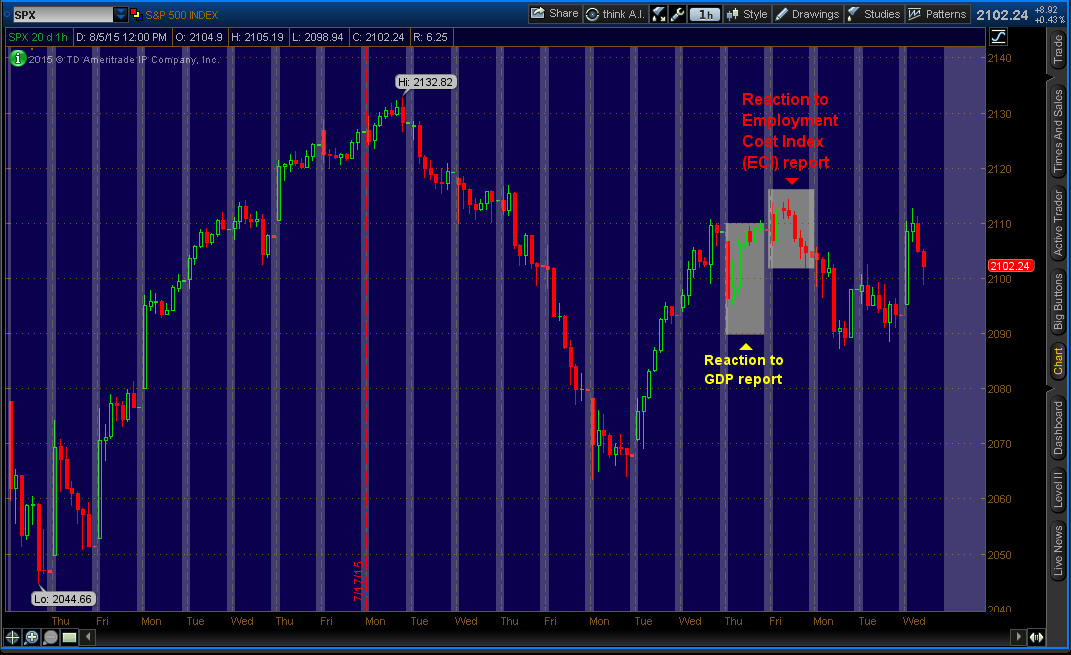
S&P 500’s reaction to both GDP and ECI reports.

S&P 500 ("SPX" on thinkorswim) - Hourly
S&P 500 (“SPX” on thinkorswim) – Hourly

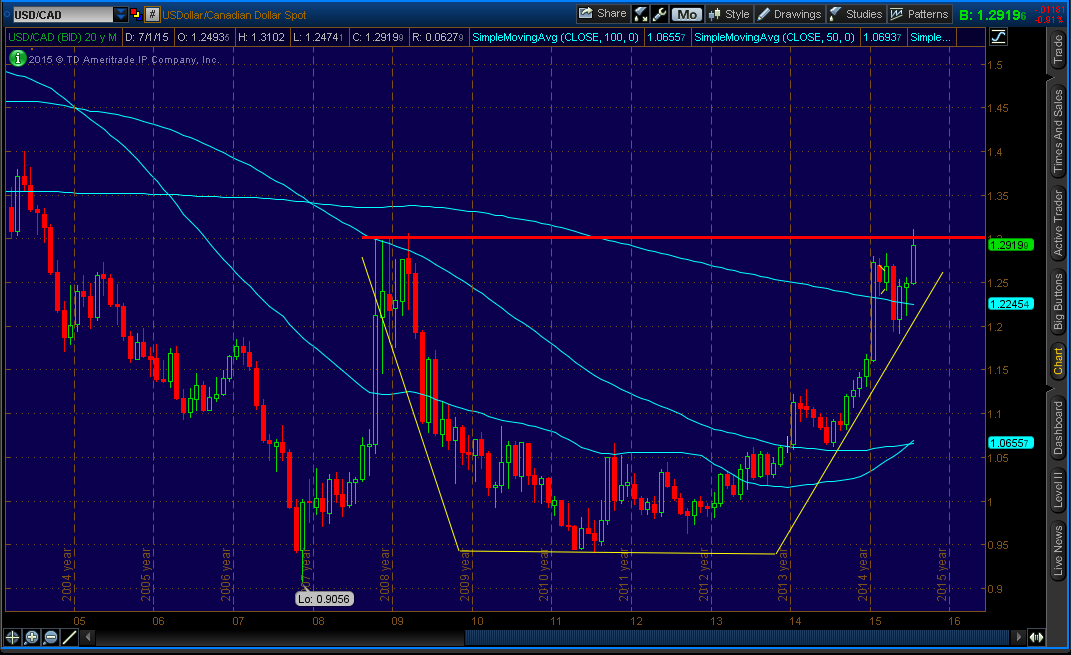
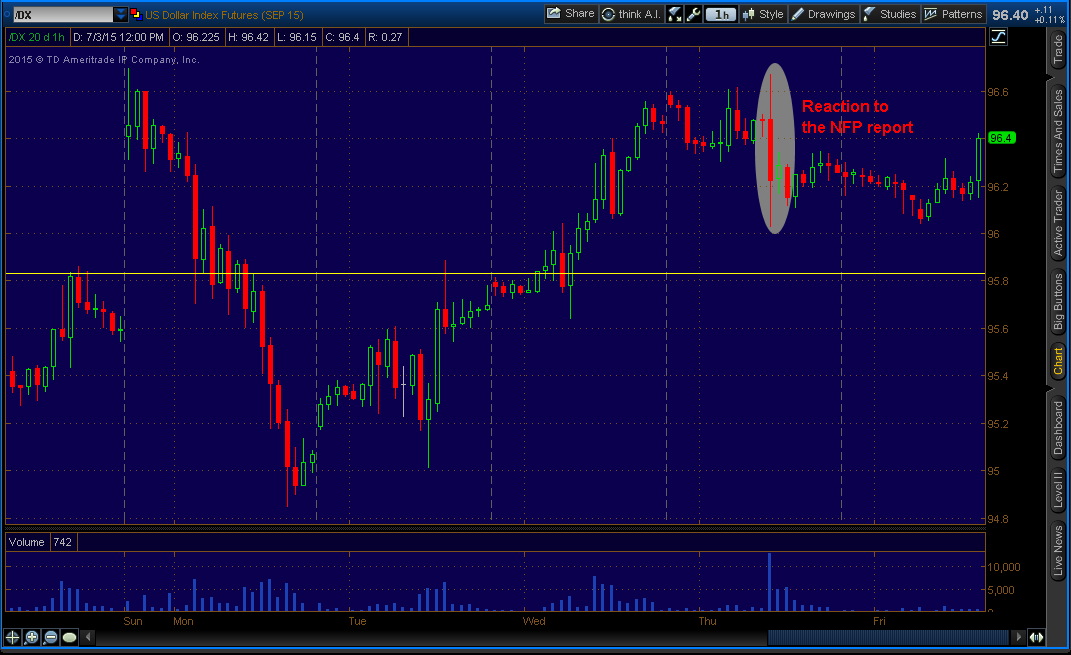
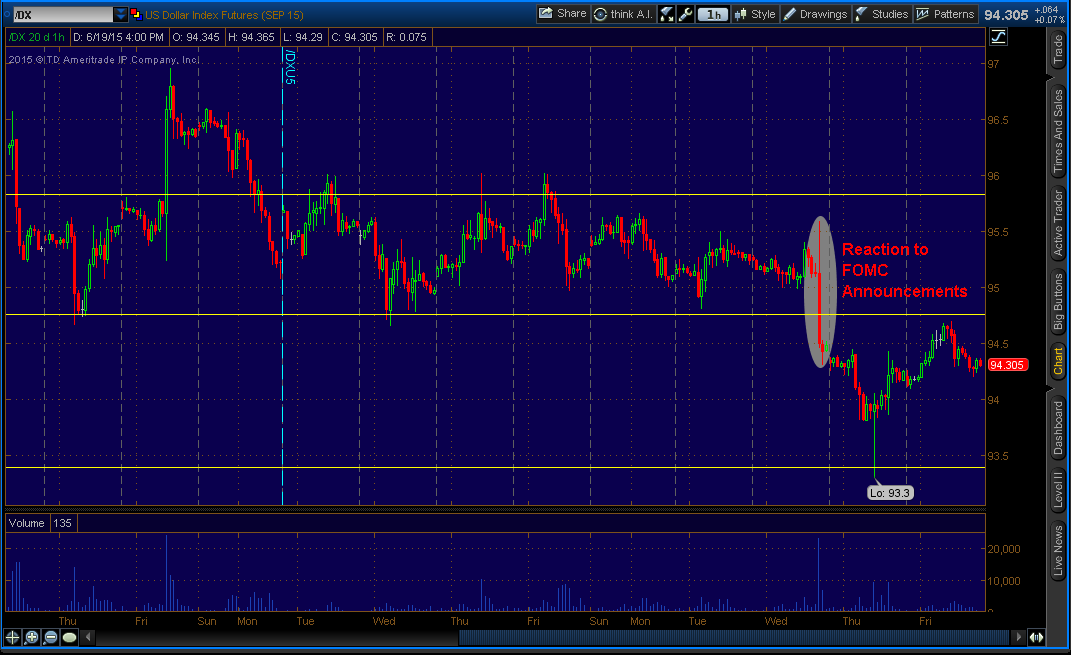
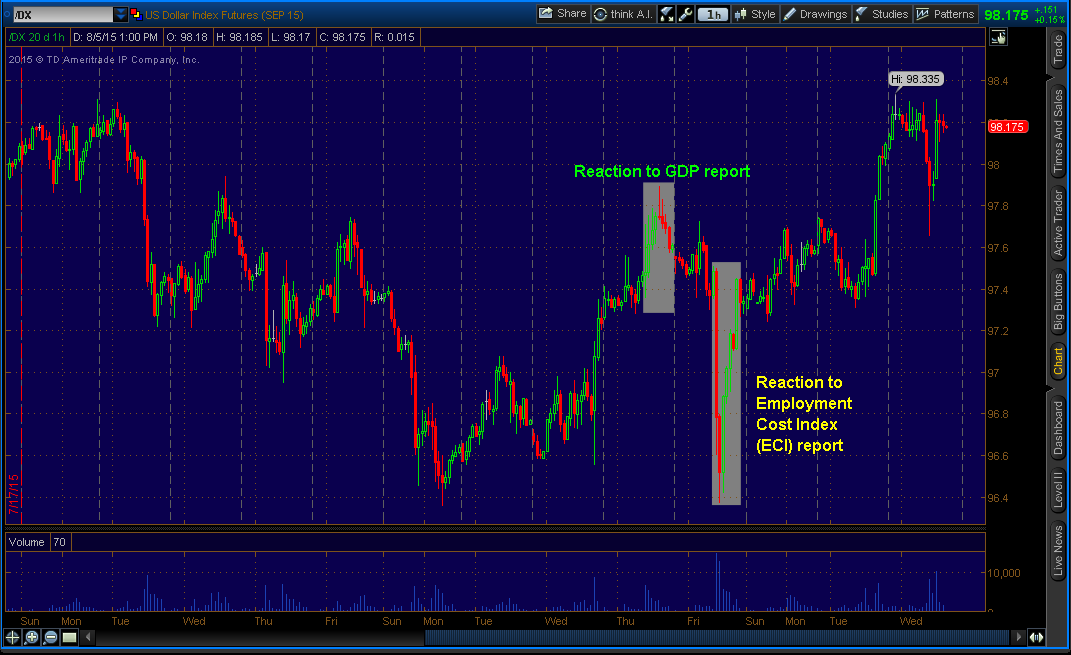
Dollar’s reaction to both GDP and ECI reports.

US Dollar ("/DX" on thinkorswim) - Hourly
US Dollar (“/DX” on thinkorswim) – Hourly

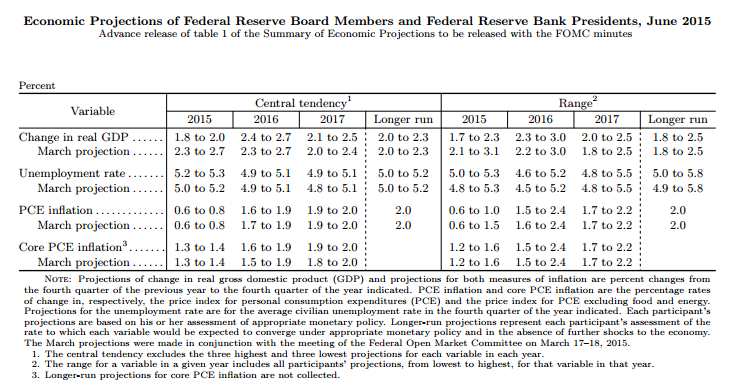
The Federal Reserve are counting on rising wages to boost both the economy and inflation (2% target). On Wednesday, July 29, the Fed said it won’t start lifting rates until there is “some further improvement in the labor market and is reasonably confident that inflation will move back to its 2 percent objective over the medium term.”

The Fed is monitoring employment, inflation, and wages closely as it moves to closer to raising interest rates from near zero, for the first time since the recession. Raising rates too soon or too late can have its consequences.

The Fed will meet on September 16 and 17. I still believe the Fed will raise rates. If employment, inflation and wage reports are not very strong until September meeting, the Fed might raise the rates by little as 0.10% (10 basis points), instead of 0.25%.

I believe the disappointment of ECI is temporary as more companies are starting to increases wages and more people are slowly entering jobs market. I also believe that GDP continues to be strong. In fact, I believe current Q2 GDP will be revised higher. Preliminary (2nd estimate) of Q2 GDP will be released on Thursday, August 27.

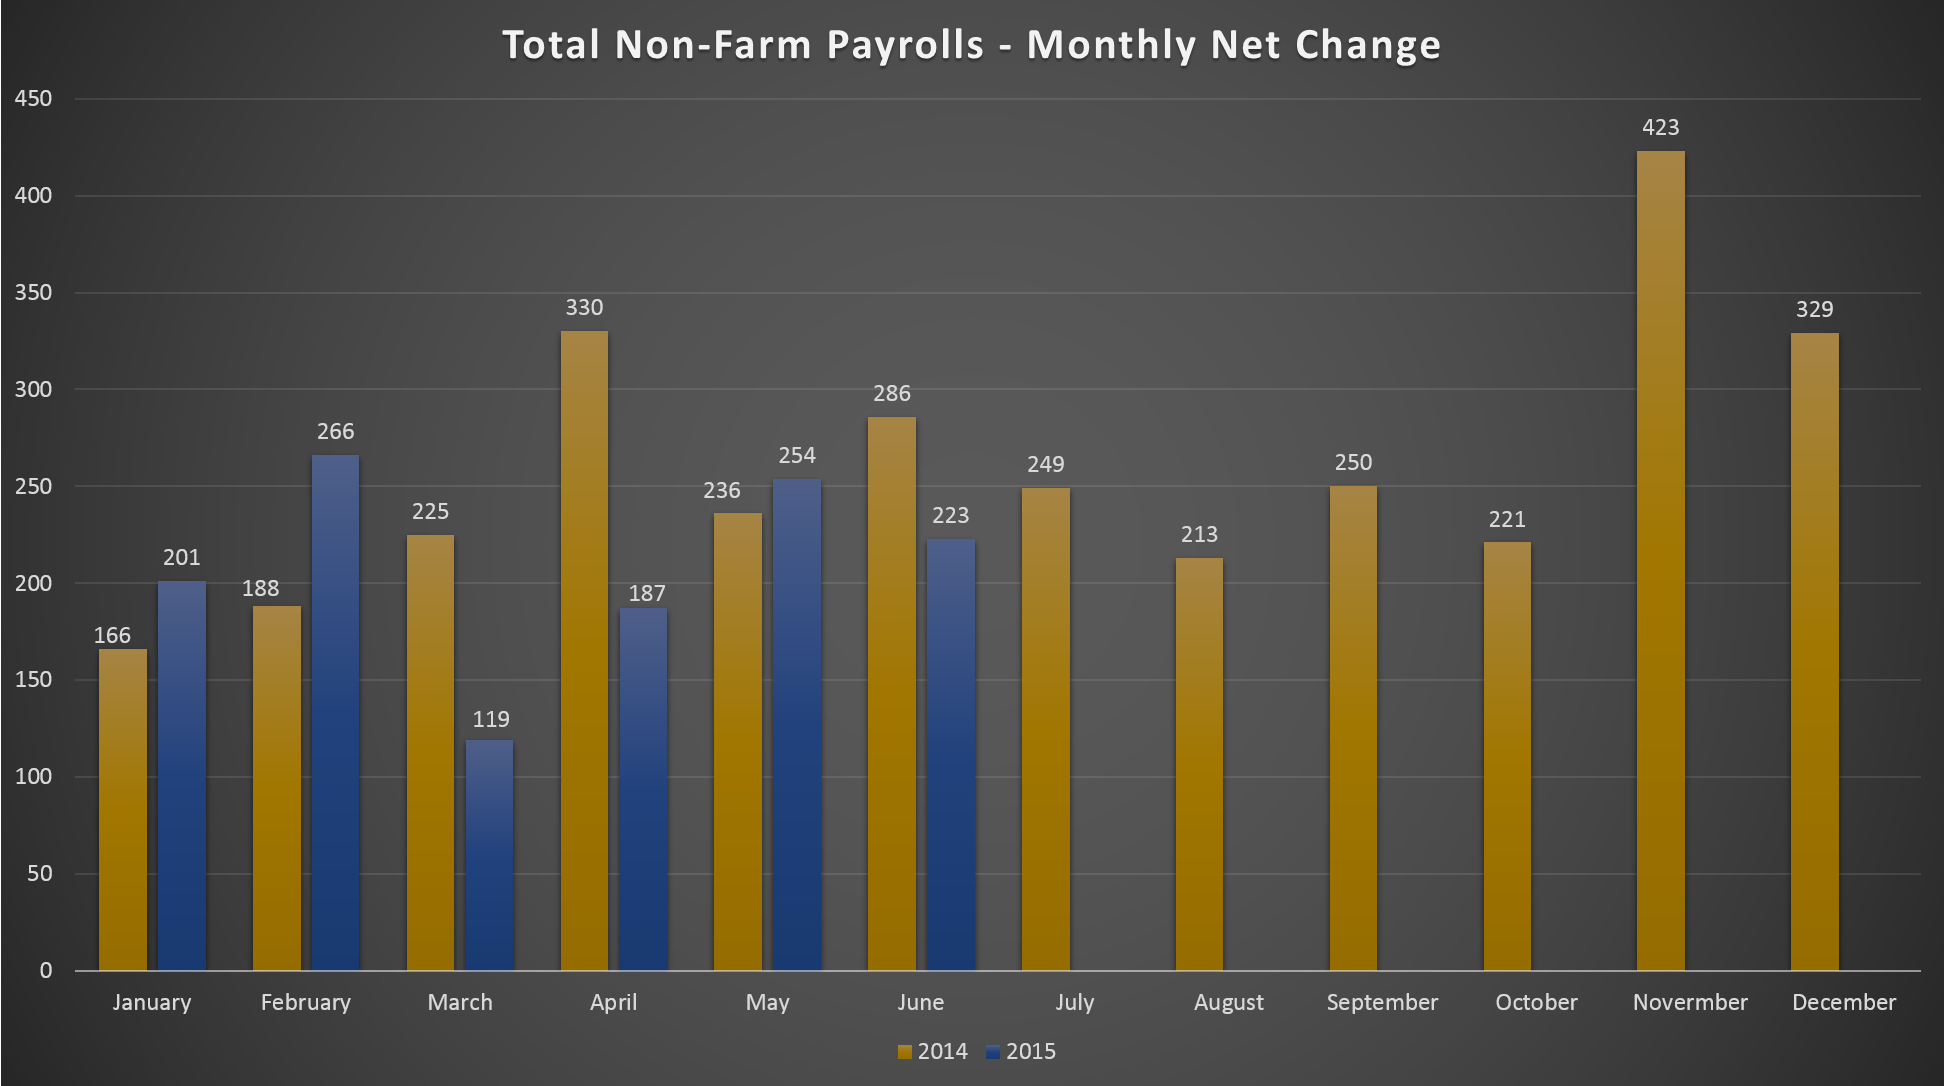
On Friday (August 7), important reading data of US economy will be released, non-farm payrolls AKA jobs report. My guess for employment and unemployment rate is 285K and 5.4%, respectively. I believe wages will stay flat at this time and accelerate in the next few months.

I will take advantage of any pullback in the greenback (US Dollar). Greenback has a room to strengthen more. Currency pairs such as USD/JPY, USD/CAD, I would be long, and I would be short EUR/USD. If you have any questions, feel free to contact me and/or leave comments below. Thank you.

Canada Crisis: Second Rate-Cut Of The Year

On July 15 (Wednesday), Canada’s central bank AKA Bank of Canada (BoC) cut overnight rate by 25 basis points (bps) from 0.75% to 50%. This is the second rate-cut this year. First rate-cut took place in January. Not only rate-cut, but lower growth forecasts.

BoC expects Gross Domestic Product growth to be 1.1% year-over-year (Y/Y) this year, down from its 1.9% forecast in April. Policy makers said that Gross domestic product probably “contracted modestly” in the first half. However, they did not call it recession. ‘‘The lower outlook for Canadian growth has increased the downside risks to inflation,’’ policy makers said.

Bank also reduced the net exports contribution to GDP by 0.8% to 0.6% from 1.4%. A stronger U.S. economy and a weaker Canadian dollar should contribute to higher export growth.

Bank of Canada's July Forecasts. Source.
Bank of Canada’s July Forecasts (Page 14). Source.

There has been a big shift in the inflation tone over the past few months:

April: “Risks to the outlook for inflation are now roughly balanced”

May: “the Bank’s assessment of risks to the inflation profile has not materially changed”

This time (July): “The lower outlook for Canadian growth has increased the downside risks to inflation”

“The Bank anticipates that the economy will return to full capacity and inflation to 2 per cent on a sustained basis in the first half of 2017.” In the April’s forecasts, the bank expected the economy to return to full capacity at the end of 2016. I can tell that the Bank is running scared.

Damages from low oil prices has been extensive.  Canada is the world’s fifth-largest oil producer and lower oil prices will definitely not help the economy. The damages from lower oil prices shrank the economy in the first half of the year.

Recently after Iran deal has been reached, oil prices fell sharply. It’s currently trading around $48. If the the deal is finalized, it won’t be very good for Canada economy since Iran might want to double its oil production, leading to much lower oil prices.

The bank also said “Additional monetary stimulus is required at this time to help return the economy to full capacity and inflation sustainably to target.” If conditions get worse, they will cut rates again.

Oil is not the only problem for Canada. Other concerns are potential bubbles in housing and consumer debt.

According to BoC’s Monetary Policy Report (June), “the vulnerability associated with household indebtedness remains important and is expected to edge higher in the near term in response to the ongoing negative impact on incomes from the sharp decline in oil prices and a projected increase in the level of household debt.” (Page 30).

Over the past few years, housing prices in Canada have skyrocketed. Lower borrowing costs will just add fuel to the fire (DEBT + HIGH PRICES IN HOUSING MARKET WITH LOW INTEREST RATES = NOT A GOOD COMBINATION) . There just might be a bubble in the housing market. But, BoC does not think so.

The next BoC meeting is on September 9th, about a week before the U.S. Federal Reserve meeting, the day that many believe lift-off from the zero interest rate policy will take place. CPI and non-farm payrolls data for July and August will decide whatever the Fed will hike or not.

Rate-cuts and plunging commodity prices, especially crude oil, has caused sell-off in Loonie. Ever since the first rate-cut of the year (January), Loonie (CAD) has weakened significantly. With strengthening dollar (USD), USD/CAD has skyrocketed. When looked at monthly chart, USD/CAD has developed ‘Cup and Handle’ formation. While this is a sign to short USD/CAD, I would be very careful because fundamentals for CAD are too weak. If I were to short it, I would put my stop above the resistance line (Bold Red line).

USD/CAD - Monthly
USD/CAD – Monthly


Disappointing Jobs Report – Bye Bye July Rate-Hike

Last Thursday (July 2, 2015), non-farm payrolls report for June for disappointing. 223,000 jobs were added in June, vs expectations of 231,000, compared with an average monthly gain of 250,000 over the last 12 months. Although payrolls grew slightly, the unemployment rate ticked lower to 5.3% from 5.5%. While this may sound to be a good thing, it is not.

Unemployment rate fell due largely to a sharp decline in labor force participation, which fell by 0.3% point to 62.6%, the lowest level since October 1977. Decline in labor force participation shows more people were discouraged by the poor employment prospects that he/she is not actively seeking employments. Therefore, they are not reflected in the unemployment rate. Bottom line: they lost confidence in the jobs markets.

Revisions to the previous months’ job totals has been negative. April fell from 221,000 to 187,000 (-34,000) and May fell from 280,000 to 254,000 (-26,000), bringing losses of 60,000.

Total Non-Farm Payrolls – Monthly Net Change – 2014-Present

Job gains/loss:

Professional/Business services: +64,000. I believe it was largely due to college students who recently graduated or got a job while in school.

Health care: +40,000. ObamaCare continues to boost earnings for health care industry. Recently, health care stocks have been hitting all-time highs.

Retail: +33,000. Well it is summer, isn’t? It’s no wonder more jobs were added in retail.

Restaurants/Bars/etc: +30,000. One word, Summer.

Mining: -4,000. Oil decline has been hitting energy industry hard. Total decline in the industry now stands at 70,000.

While employment numbers are important to the Fed to justify the time to begin normalizing policy, I believe wage growth and Consumer Price Index (CPI) are more important. July rate-hike is off the table largely because wages remained flat. Average hourly earnings in the private sector stood at $24.95, unchanged from May and up 2% from a year earlier.

Average Hourly Earnings - 2014 to Present
Average Hourly Earnings – 2014 to Present

On July 17, CPI report for June will be released at 8:30 AM EST. It will be very important to watch for it. Any spending reports such as Retail Sales will also be important to watch out for because consumer spending makes up 70% of all economic activity. Retail sales account for one-third of it.

I strongly believe September rate liftoff is possible. If future CPI, average hourly earnings, and employment fall in any way, chance of liftoff in September will be reduced.

Following the release of the report on Thursday, US markets were mixed while US Dollar was down. US markers were closed due to 4th of July holiday. The United States is 239 years old.

Standard & Poor 500 ( “SPX” on ThinkorSwim platform) – Hourly
US Dollar ( “/DX” on ThinkorSwim platform) – Hourly


Thank you for reading. If you have any questions, feel free to contact me. You can leave a comment and contact me on this website, google plus, twitter, and linkedin. Thank you.

The Fed On Hold…For Now

Last Wednesday (June 17, 2015), Federal Reserve released high anticipated FOMC statement, FOMC Economic Projections, and of course the Federal Funds Rate (interest rate). Federal Open Market Committee (FOMC) kept the interest rates on hold while they decreased their rate projections for 2016 and 2017.

The projections, or “dot plot”, which shows where FOMC members expect interest rates in the future, suggest that there will be one, or two quarter percentage (%) point interest rate increase by the end of the year. In March, the projections suggested more than two quarter percentage increases. That was before they knew that the first quarter of 2015 dragged on the economy…temporarily. 15 of 17 FOMC members believe that the first rate-hike will take place this year, same as March’s projections. Five officials foresee one increase in the rates this year by quarter percentage point, up from 1 official in March. Another five officials foresee 0.50% increase this year, down from seven officials in March. Two officials wants to keep rates unchanged this year. In March, officials did not know if the first quarter slump was temporary or not. They just believed negative economic news were due to “transitory effects” which includes West Port strike, low energy prices, bad weather, and  stronger dollar. Now that we been seeing more positive economic news, many officials believe first quarter slump was temporary.

Officials reduced their median estimate for the federal funds rate by the end of 2016 to 1.625% from 1.875% in March, and to 2.875% by the end of 2017, down from 3.125% in March.

FOMC Economic Projections
FOMC Economic Projections – June 2015 —– Source: Federal Reserve
FOMC Economic Projections - March 2015 ----- Source: Federal Reserve
FOMC Economic Projections – March 2015 —– Source: Federal Reserve

The Fed lowered their economic projections for 2015. They see economic output growth to 1.8% to 2.0%, from 2.3% to 2.7% in March. For 2016, it is seen growing by 2.4% to 2.7%, from 2.3% to 2.7% in March. For 2017, it is seen growing by 2.1% to 2.5%, from 2.0% to 2.4% in March. For 2016 and 2017, it’s essentially the same forecasts. They also changed their forecasts slightly for unemployment rate and inflation.

FOMC Economic Projections - June 2015 ----- Source: Federal Reserve
FOMC Economic Projections – June 2015 —– Source: Federal Reserve

In the statement, Fed policy makers reiterated that they must see “further improvement in the labor market” and be “reasonable confident that inflation will move back to its 2 percent objective over the medium term”. If the labor market continues to improve like they did in May, and inflation continues to improve, I strongly believe we will see rate-hike in July or September. It’s likely to be September because there will be no press conference in July. If the federal funds rate is increased in July, there will so much uncertainty and volatility in the markets because the Fed will not have a chance to explain their actions. However, there still might be rate-hike in July because the Fed wouldn’t want to increase rates too late.

During the press conference, Yellen said “…we have seen some progress. Even so, the Committee judged that economic conditions do not yet warrant an increase in the federal funds rate. While the Committee views the disappointing economic performance in the first quarter as largely transitory, my colleagues and I would like to see more decisive evidence that a moderate pace of economic growth will be sustained, so that conditions in the labor market will continue to improve and inflation will move back to 2 percent.” It shows that the Fed is not confident enough to raise the rates yet. She said that the policy will be “data dependent”. I believe future US economic reports will be positive until December when we might get unfavorable weather again. Bad weather always derails the Fed’s view on the policy because it affects majority of country.

Regarding the US Dollar, or Greenback, Yellen said that the dollar “appears to have largely stabilized” and its significant appreciation is going to continue to drag on the economy for some time to come. The dollar has risen more than 15% against major currencies over the last 12 months.

US markets rose after the Fed announcements while the greenback (US Dollar) slipped. US markets continued to rise the next day.

Standard & Poor 500 ( "SPX" on ThinkorSwim platform) - Hourly
Standard & Poor 500 ( “SPX” on ThinkorSwim platform) – Hourly
US Dollar ( "/DX" on ThinkorSwim platform) - Hourly
US Dollar ( “/DX” on ThinkorSwim platform) – Hourly