
On June 23rd, Britain people will vote to stay in or leave (Brexit) the European Union. The verdict matters a lot since it is a life-changing decision. I will briefly address some of the pros and cons of Brexit, but will further address it after the vote, especially if UK leaves EU.
Brexit Pros:
- The European Union costs United Kingdom 350 million pounds ($503 million) a week. That’s $26.2 billion a year, 4.6 times less the UK education budget of $121.1 billion in 2015. That $26.2 billion is 1% of 2015 GDP of $2.63 trillion. That $26.2 billion is 2.45% of 2015 total spending of $1.07 trillion.
Note: That 350 million pounds a week cost is before “the rebate.” In 2015, Britain actually paid under 250 million ($359 million) pounds a week. But hey, UK does not control the rebates. The cost of membership has been increasing over the years, especially after the financial crisis.
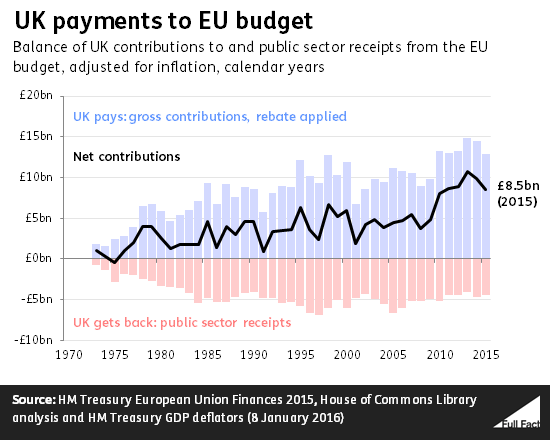
What happened with Greece and is still happening, is a warning sign of more economic troubles to come in Europe. That possibly will continue to increase the cost of EU membership.
- Under EU fundamental right of free movement, Britain cannot prevent anyone from another member state coming in to the country. This has resulted in a huge increase in immigration into Britain from Europe.
In 2015, 270,000 EU citizens immigrated to the UK and 85,000 EU citizens emigrated aboard. Net-migration was 185,000.
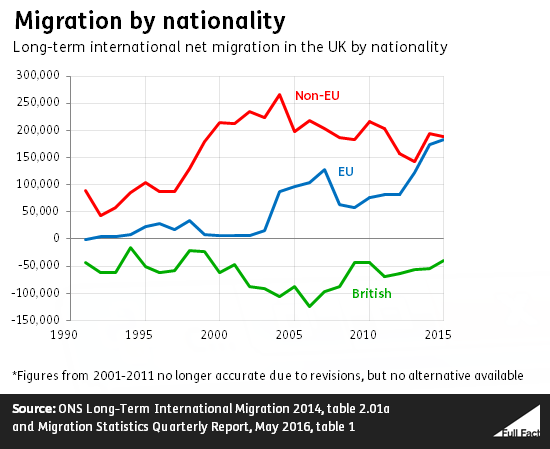
2.94 million people living in the UK in 2014 were citizens of another EU member country. Those people account for 4.7% of the UK population.
2.2 million citizens of another EU member country are in work, 7.02% of working population. Majority of EU member citizens are coming to the UK for work reasons. 61% of the migration who came for work reasons were EU citizens.
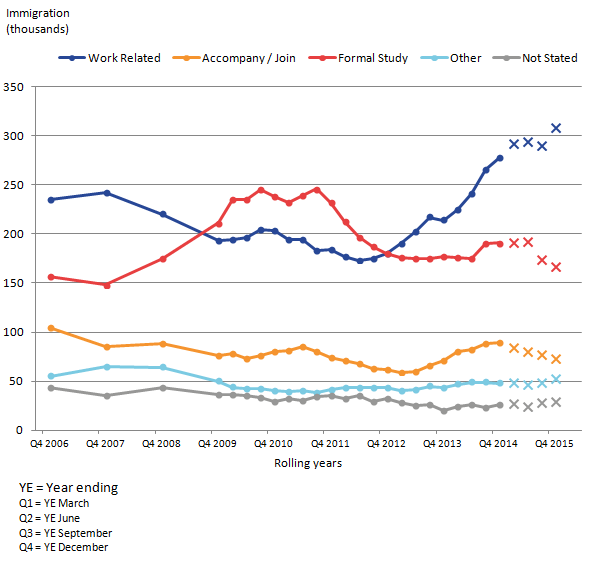
See how EU citizens coming to the UK for work reason started to accelerate in 2013. This can be related to economic difficulties such as Greece, Spain, Portugal and Italy. As I mentioned above, “What happened with Greece and is still happening, is a warning sign of more economic troubles to come in Europe.” That should lead to even more upsurge in migration for work reason, making it more competitive for UK citizens to find jobs and possibly lowering wages.
If UK decides to leave EU, the country would be able to reform immigration laws without input from the EU and increase jobs and wages for UK citizens (hopefully they have the skills).
Brexit Cons:
- EU membership makes UK attractive for international investment and provides access to trade deals with more than 50 countries around the world (expensive makeup, isn’t it?). Because EU institutions have the ability to prevent the UK from negotiating its own trade deals outside Europe, it would have to re-negotiate some trade deals, with EU and non-EU countries including the US, China, Japan and India. It is extremely possible the Brexit will impair confidence and investment for few years.
In 2015, the EU accounted for (pdf download) 43.7% of exports and 53.1% of imports
In 2014, the EU accounted for 496 billion pounds ($712 billion) of the stock of inward Foreign Direct Investment (FDI), 48% of the total. Globally, the UK is the third largest country in terms of its absolute value of inward FDI stock ($1.7 trillion), followed by China ($2.7 trillion) and U.S. ($5.4 trillion).
Why is FDI so important? It has the potential for job creation and productivity, increasing both output and wages.
If UK were to leave EU, it would dampen FDI due to uncertainty of the future. Firms would reduce investment in UK, leading to lay offs and so on (domino effect).
3.3 million UK jobs are linked to UK exports to other EU countries. Auto industry would be particularly at risk. In 2015, 77.3% of cars built in the UK were exported, a record high. EU demand grew 11.3%, with 57.5% of exports destined for the continent. In 2014, the motor vehicle manufacturing accounted for 7.9% (pdf download) of total manufacturing, up from 5.4% in 2007. The end of free trade agreements would definitely hurt UK automotive industry.
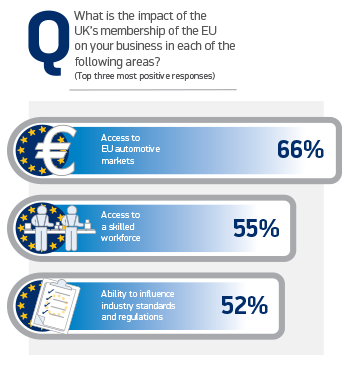
If UK were to leave the Single Market (EU), locating production in the UK would be less attractive because it would become more costly to ship to EU members. 77% of members of SMMT (Society of Motor Manufacturers and Traders) – the voice of the UK motor industry – believes remaining in EU would be the best for their business. 9% believes Brexit is the best path. 14% doesn’t know, like economists don’t know the real impact of Brexit due to a large base of issues and views.
66% believes EU important to them because of its access to EU automotive markets.
Brexit would send a ripple effect. For the government (less tax revenue), for businesses (rising costs) and for consumers (lower income).
There’s also the issue of UK citizens in the other EU member countries. They have the right to live, work, vote, run a business, buy a property, and use public services such as health. Some, if not all, of these rights could vanish if UK leaves the EU.
Sure, UK will try to protect them. Since one of the main goals of Brexit is stop the inflows of immigrants into UK from EU, EU might retaliate against it.
UK (the wife) has been married to EU (the husband) for 43 years (UK joined EU in 1973). Part of her wants to get out of the cage. Other part of her wants to keep some of the benefits. If Brexit, it will be very expensive and messy divorce, but may be for the good.
There are so many views on this “monumental” and “out-of-focus” complicated issue. Not every issue is covered in this article. If UK is the first country to leave EU, I will do much more research and analyze it.
If you have any views, I would love to know in the comments below. If you have any questions about any issues related to Brexit, I would be happy to answer them ASAP. Don’t be surprised if the answer is 5 paragraphs long. Thank you.