
UPDATE: This article is also posted on Seeking Alpha. For the first time, my article was accepted to be on Seeking Alpha. The link to the article on Seeking Alpha can be found here, or http://seekingalpha.com/article/3707566-eli-lilly-is-overvalued-too-costly-to-buy.
On October 22, Eli Lilly (LLY) reported an increase in the third-quarter profit, as sales in its animal health segment and new drug launches offset the effect of unfavorable foreign exchange rates and patent expirations. Indianapolis-based drug maker posted a net income increase of 60% to $799.7 million, or to $0.75 per share, as its revenue increased 33% in animal health segment. In January 2015, Eli Lilly acquired Norvartis’s animal health unit for $5.29 billion in an all-cash transaction. The increase in the animal-health revenue helped offset sharp revenue decreases in osteoporosis treatment Evista and antidepressant Cymbalta, whose revenue fell 35% and 34% year-over-year, respectively. Eli Lilly lost U.S. patent protection for both drugs last year, causing patent cliffs. Lower price for the Evista reduced sales by about 2%.
Total revenue increased 2% to $4.96 billion even as currency headwinds, including strong U.S. dollar, shaved 8% off of the top line in revenue. Recently launched diabetes drug Trulicity and bladder-cancer treatment Cyramza helped increase profits, bringing a total of $270.6 billion in the third-quarter. Eli Lilly lifted its guidance for full-year 2015. They expect earnings per share in the range of $2.40 and $2.45, from prior guidance of $2.20 to $2.30.
Despite the stronger third-quarter financial results, I believe Eli Lilly is overvalued. Eli Lilly discovers, develops, manufactures, and sells pharmaceutical products for humans and animals worldwide. The drug maker recently stopped development of the cholesterol treatment evacetrapib because the drug wasn’t effective. Eli Lilly deployed a substantial amount of capital to fund Evacetrapib, which was in Phase 3 research, until they decided to pull the plug on it. The suspension to the development of Evacetrapib is expected to result in a fourth-quarter charge to research and development expense of up to $90 million pre-tax, or about $0.05 per share after-tax. Eli Lilly’s third-quarter operating expense declined 7% year-over-year, mainly due to spending on experimental drugs that failed in late-stage testing trials.
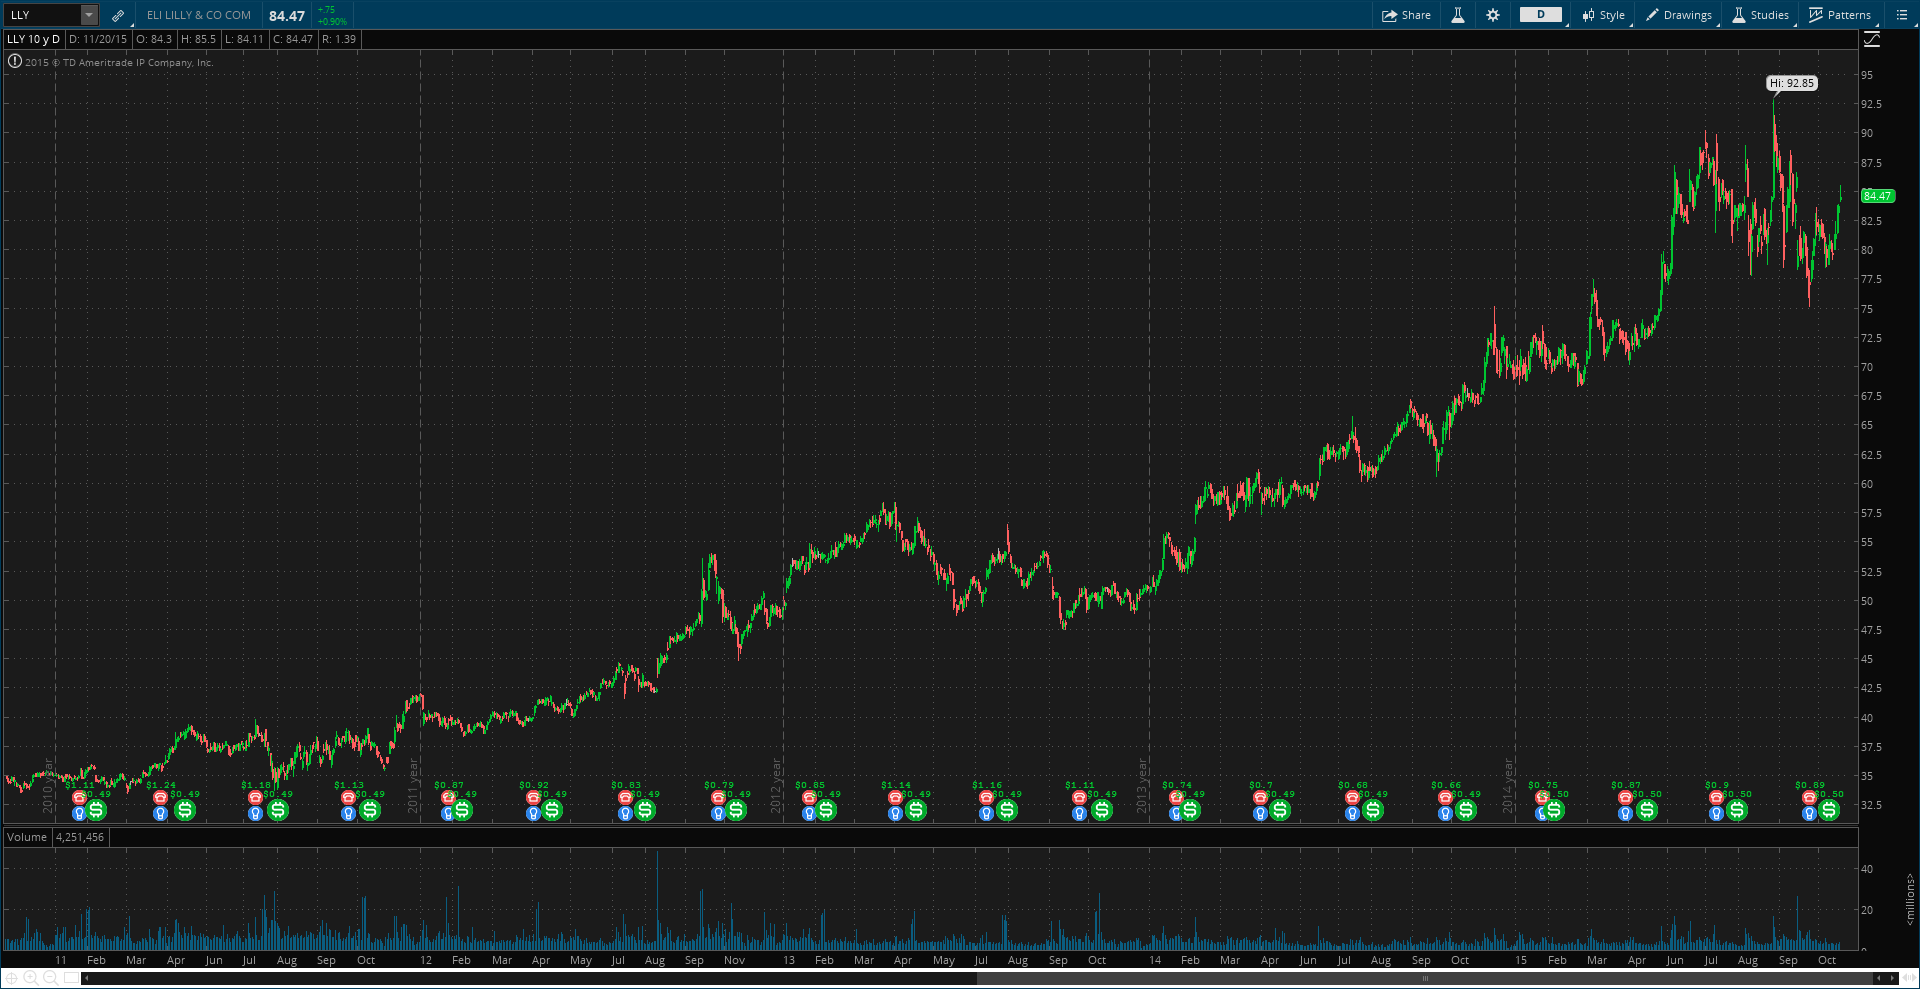
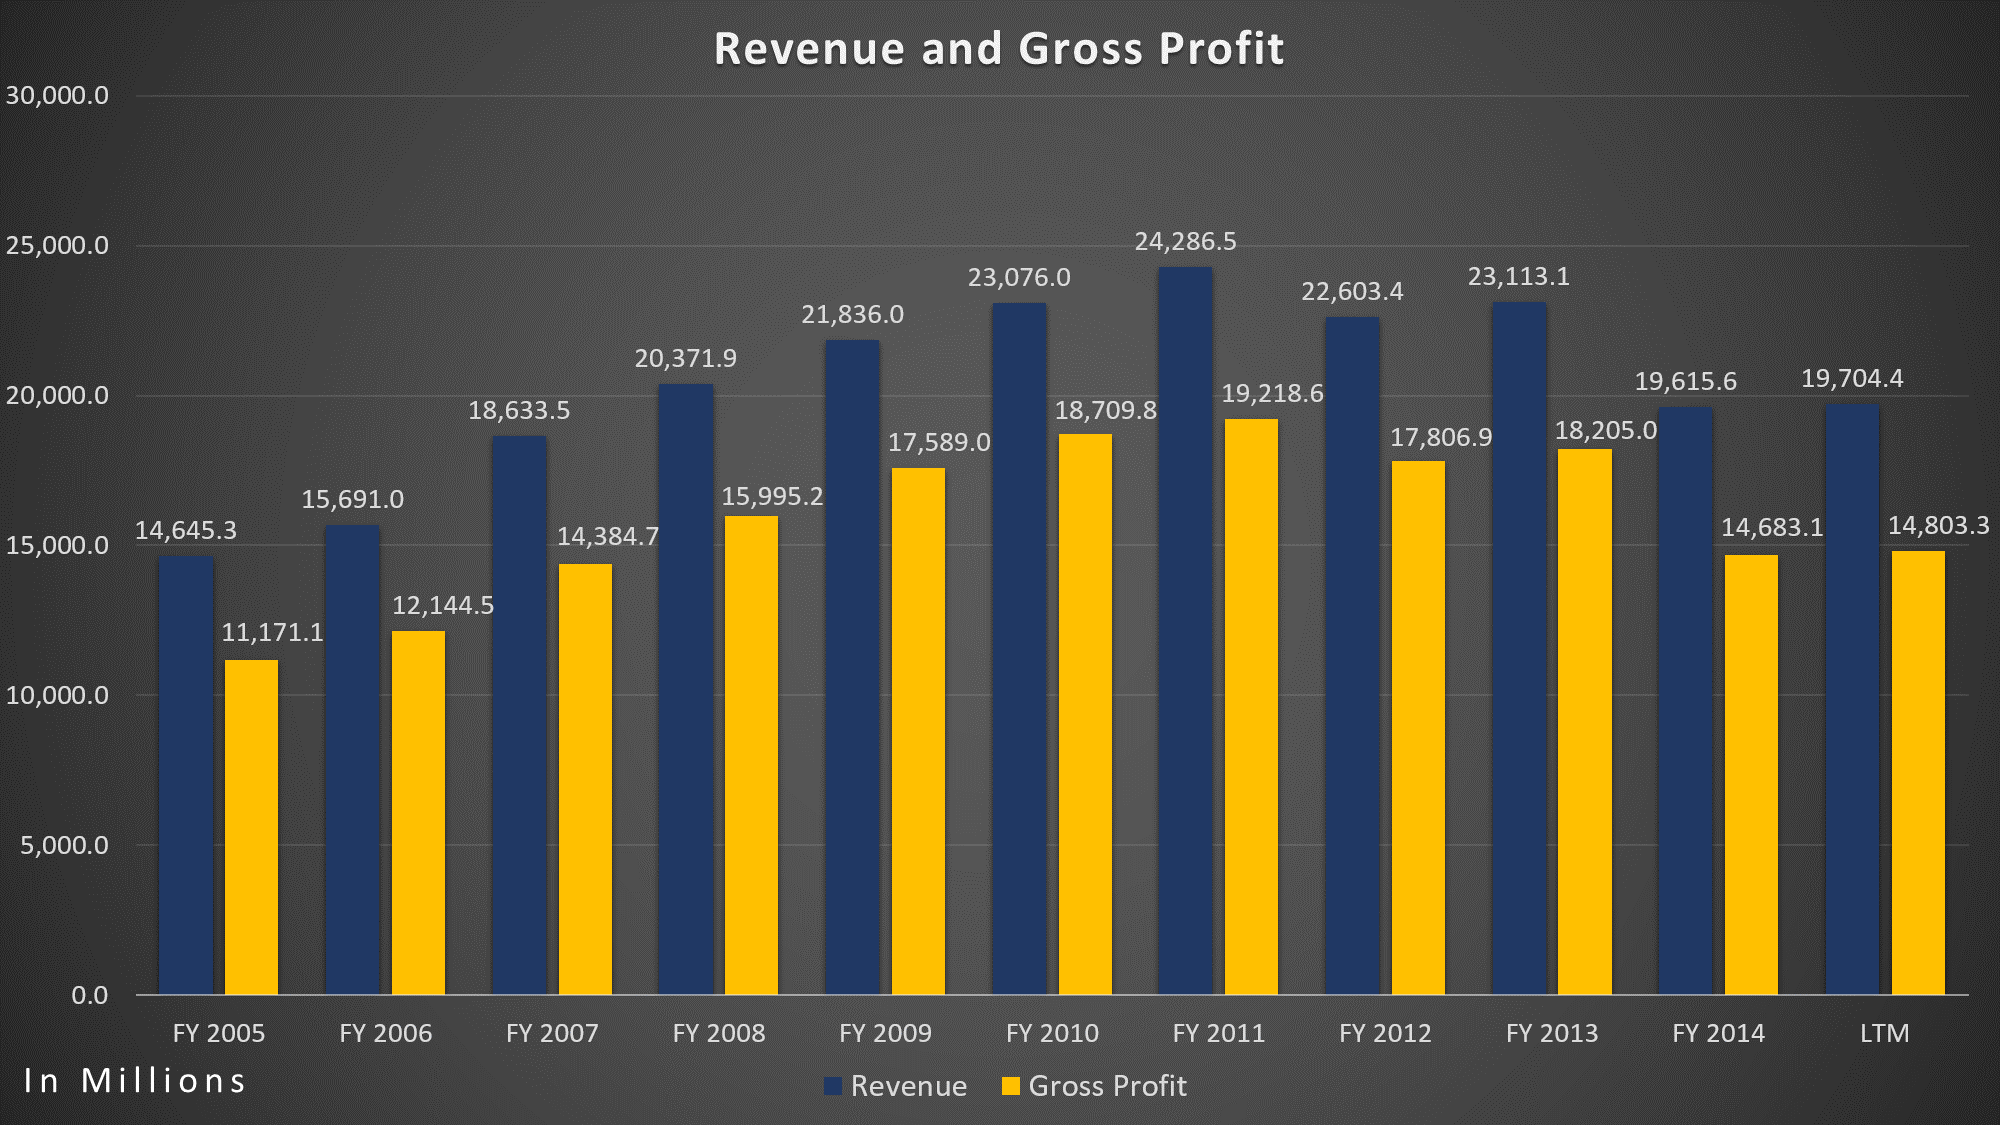
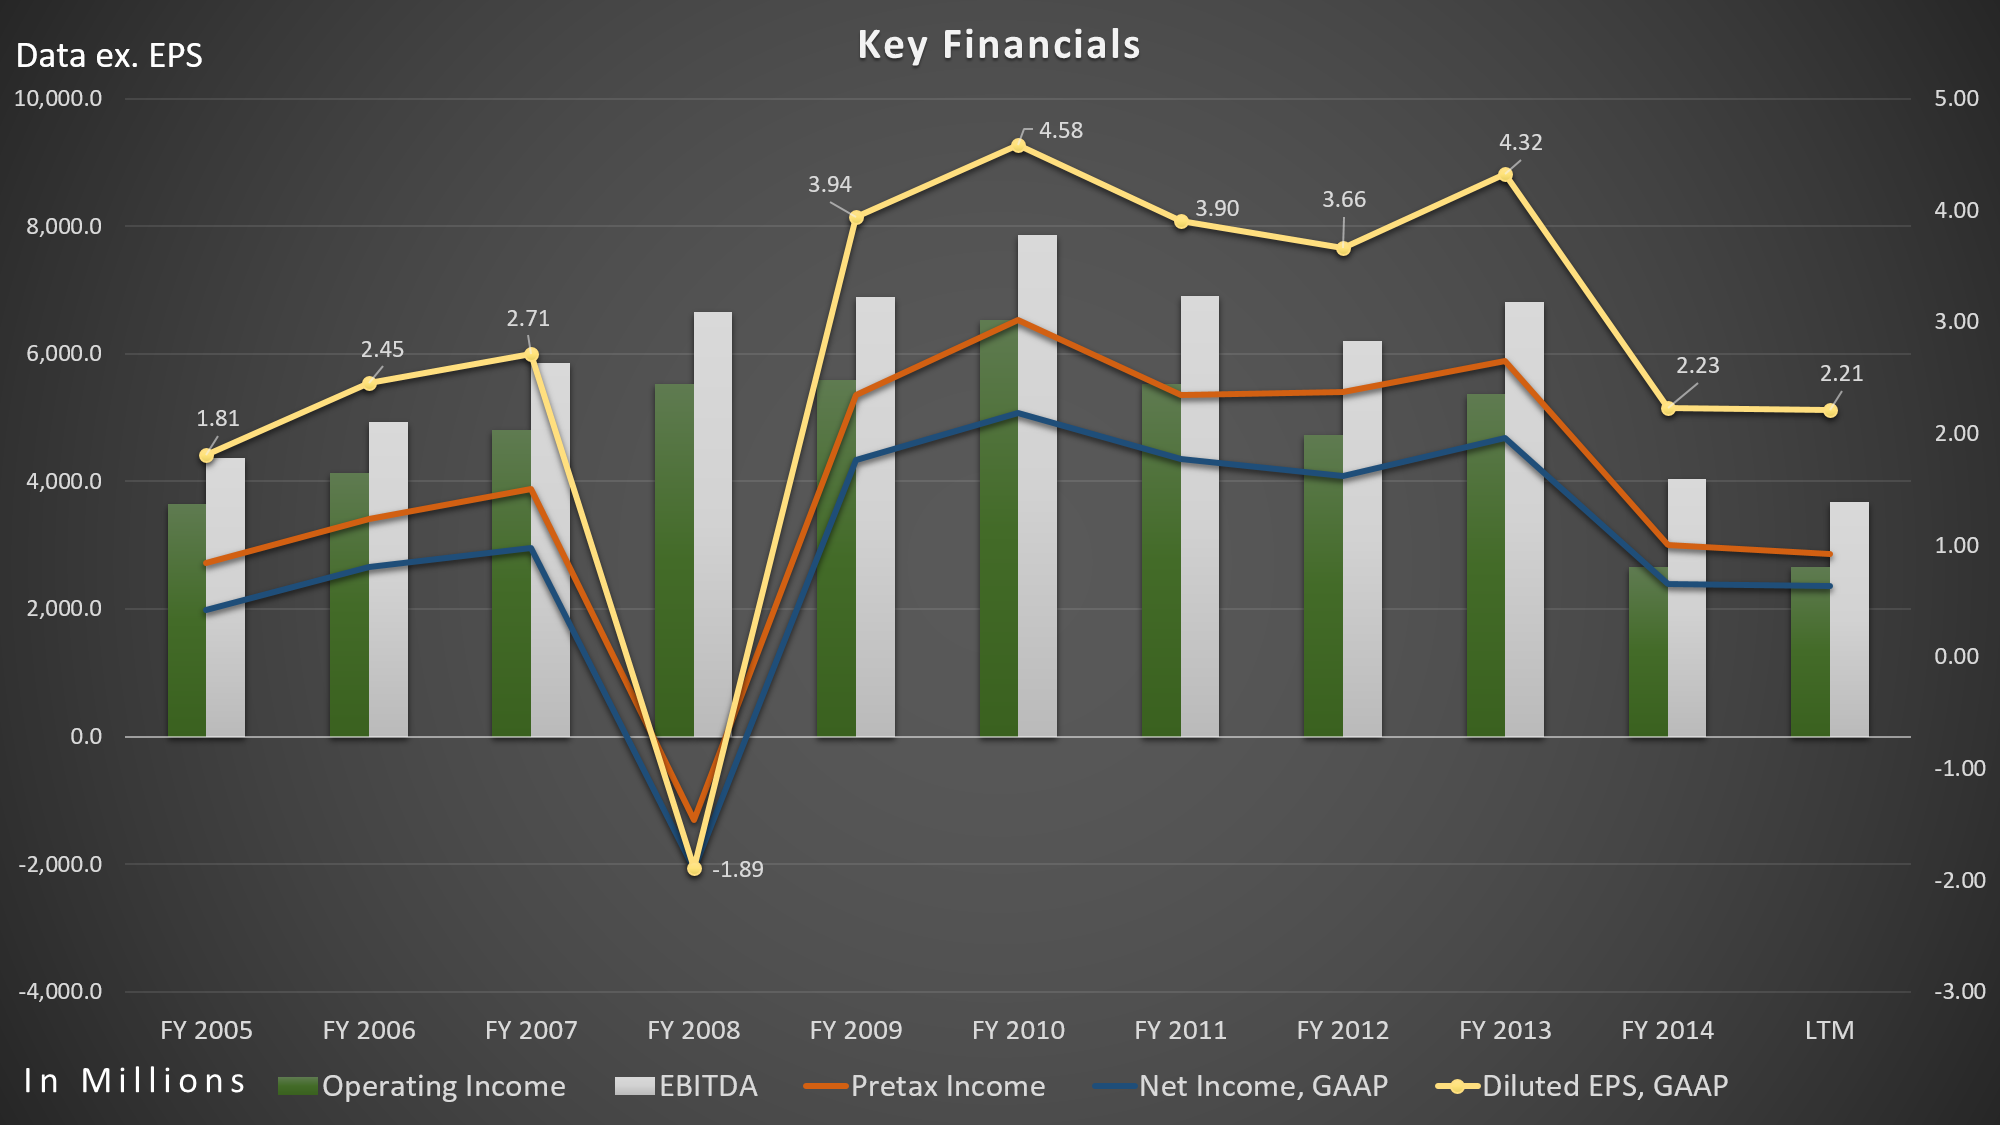
Eli Lilly’s market capitalization skyrocketed over the past five years by 122.76% to $90 billion, but their revenue, gross profit, net-income, operating income, as well as EBITDA, declined significantly. Over the past five years, its revenue decreased 14.61% from $23.08 billion to $19.70 billion (LTM), largely due to patent expirations. Gross profit and net-income declined 26.06% and 53.48%, respectively. Its operating income fell 59.18% over the past five years.
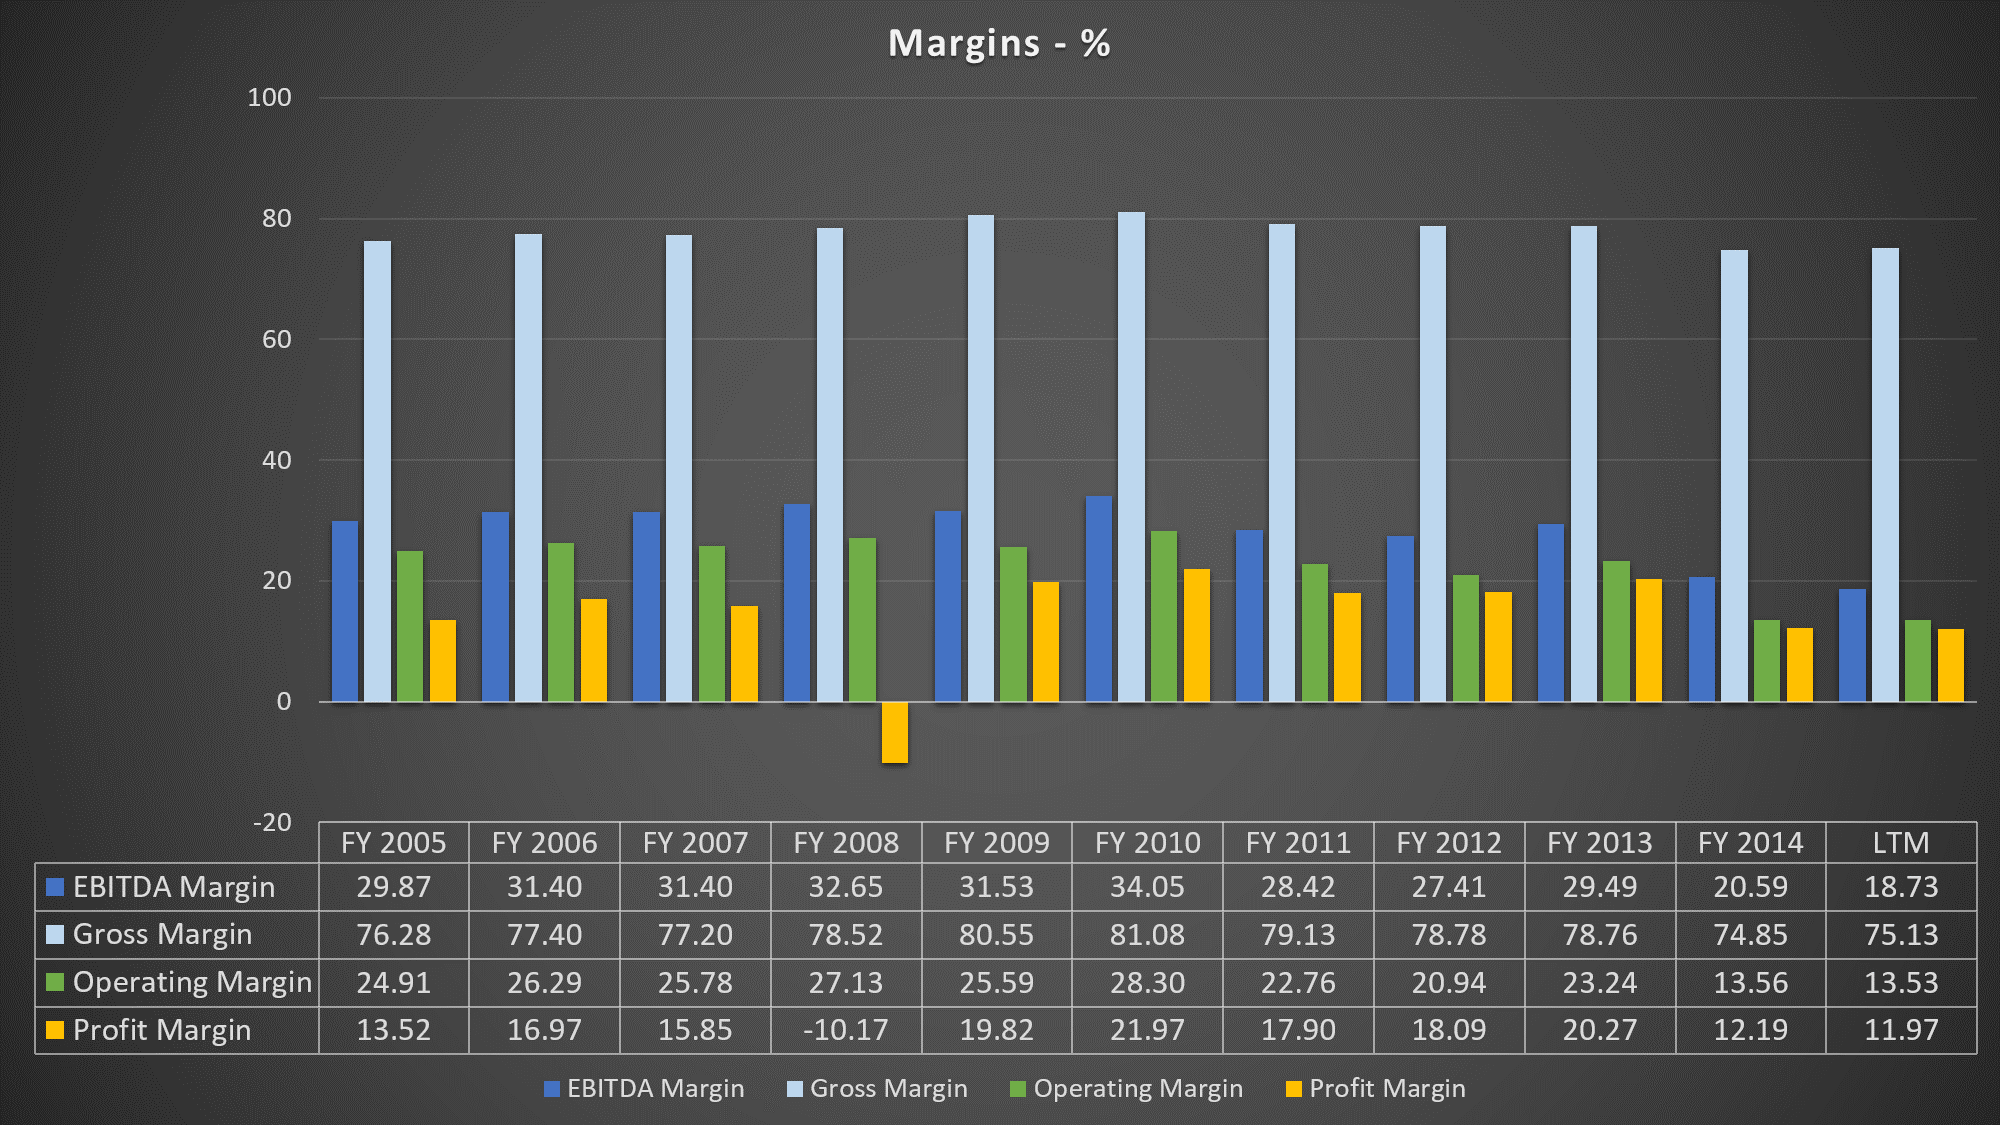
Its operating margin fell a halfway over the past five years from 28.30% to 13.53% (LTM). EBITDA margin, on the other hand, fell all the way to 18.73% (LTM) from 34.05%.
Meanwhile, shares of Eli Lilly gained 144.49% over the past five years. Its price-to-sales ratio too high compared to its history and to S&P 500. Its Price/Sales ratio currently stands at 4.6, vs. at 1.7 in 2010, while S&P 500 currently stays at 1.8 and industry average at 3.9. In addition to the falling revenue, gross profit, net-income, and EBITDA, its free cash flow fell significantly over the past five years by 72.24%, or fell 22.61% on a compounded annual basis.
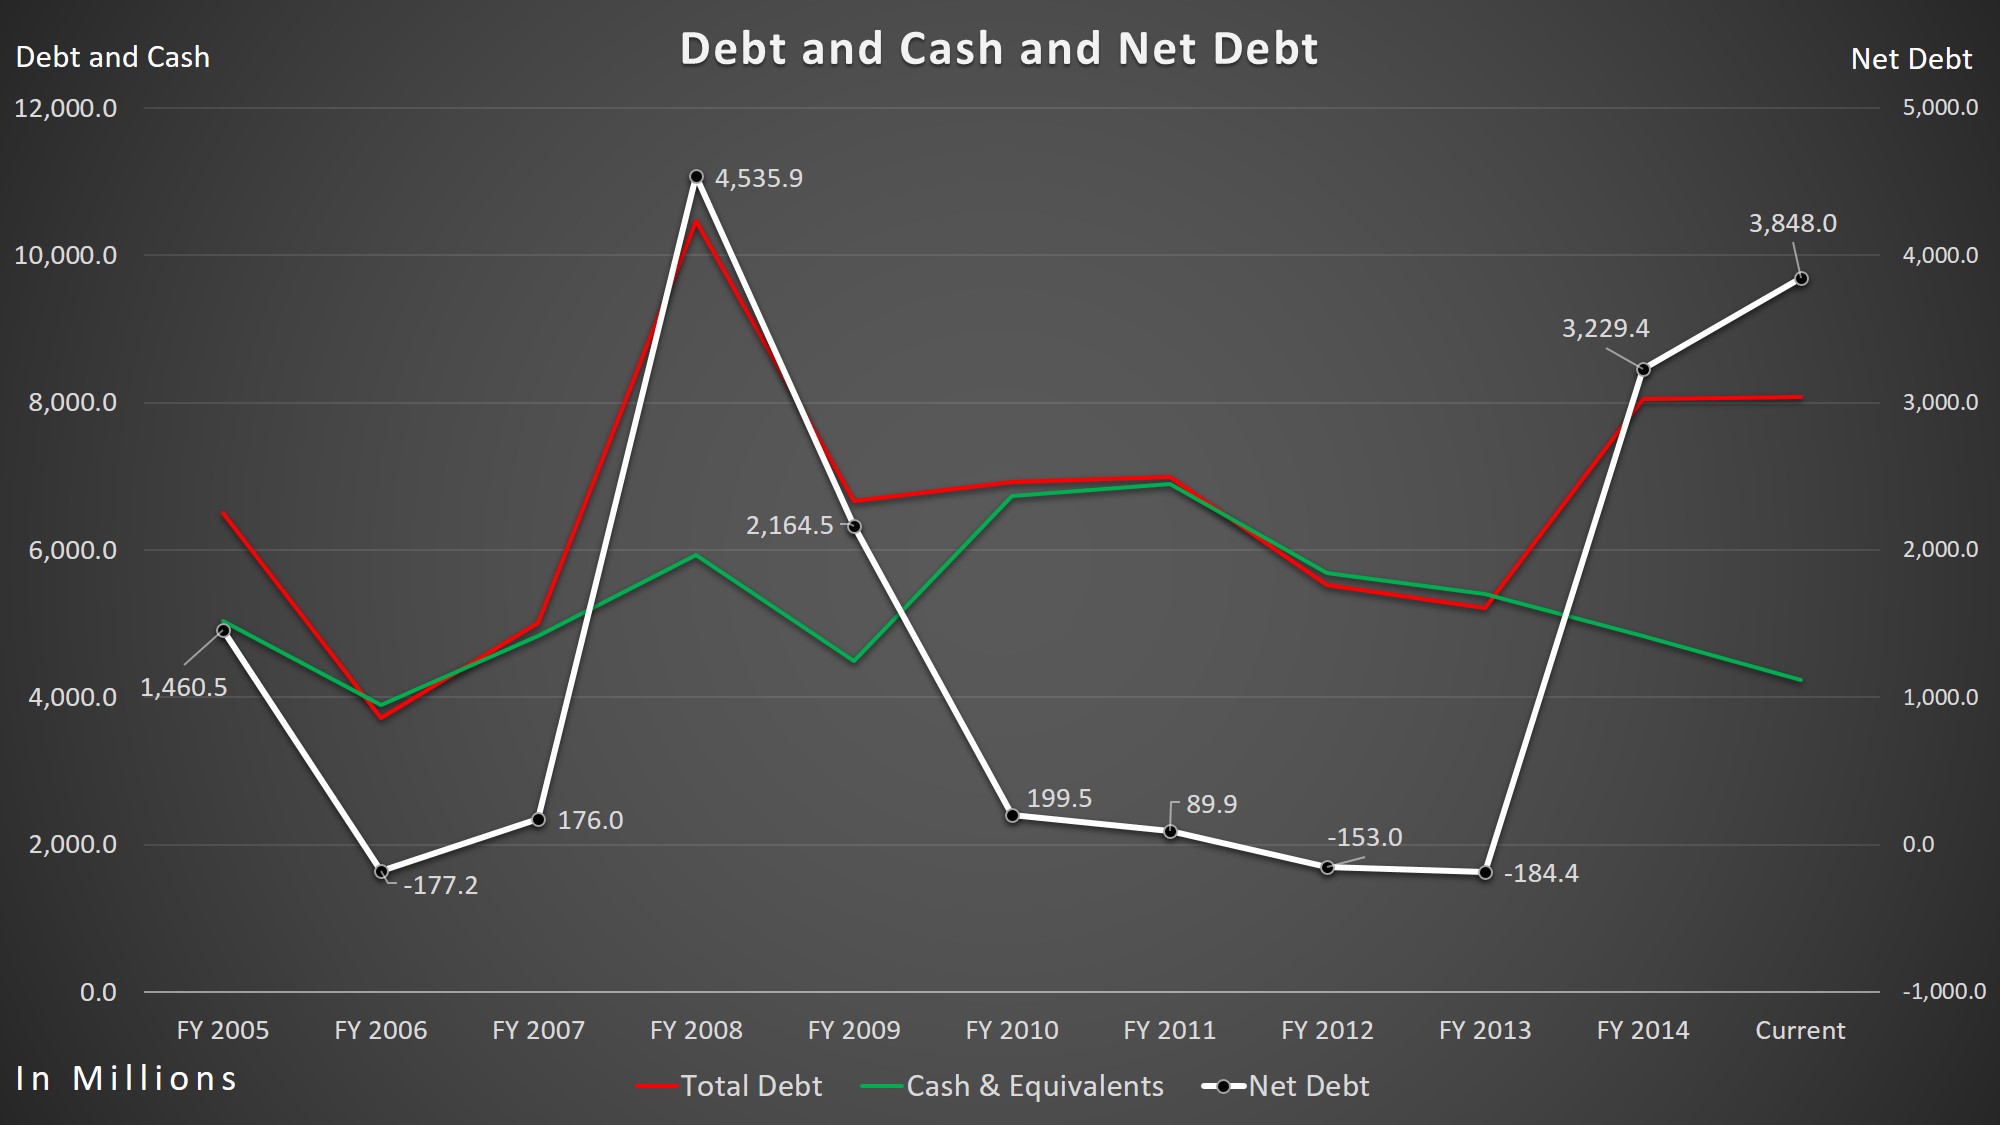
Not only did their cash flow fall, but their net-debt increased significantly. Its net-debt increased by a whopping 1789.87% over the past five years from $199.5 million to $3.85 billion. They now have almost twice as much of total debt than they do in cash and equivalents. I believe Eli Lilly is at a risk for poor future ratings by rating agencies, which will increase their borrowing costs.
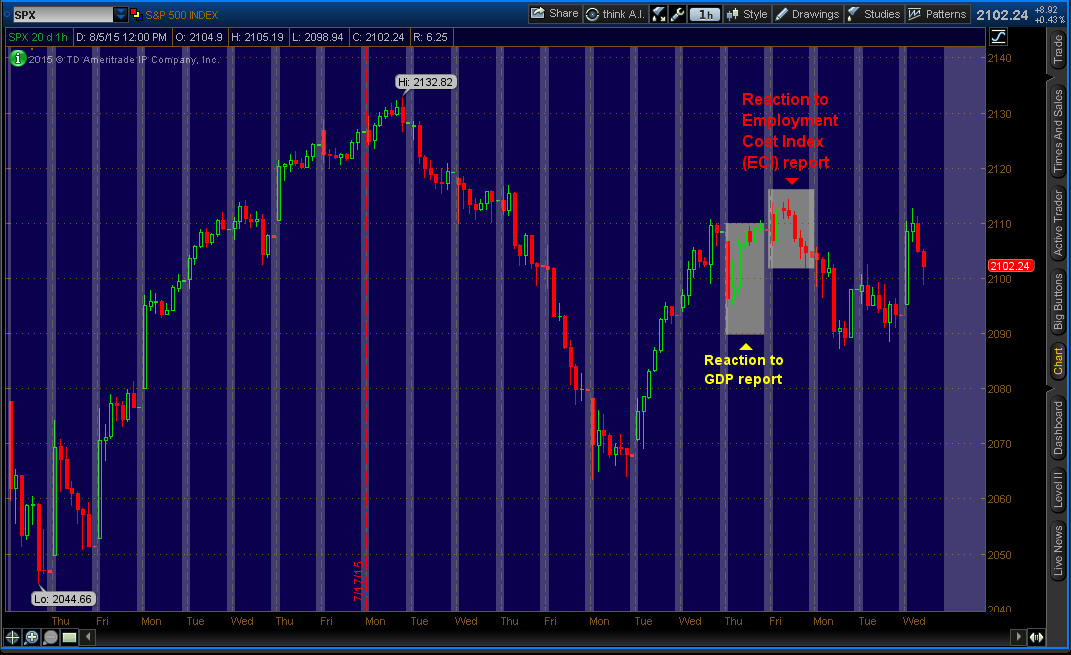
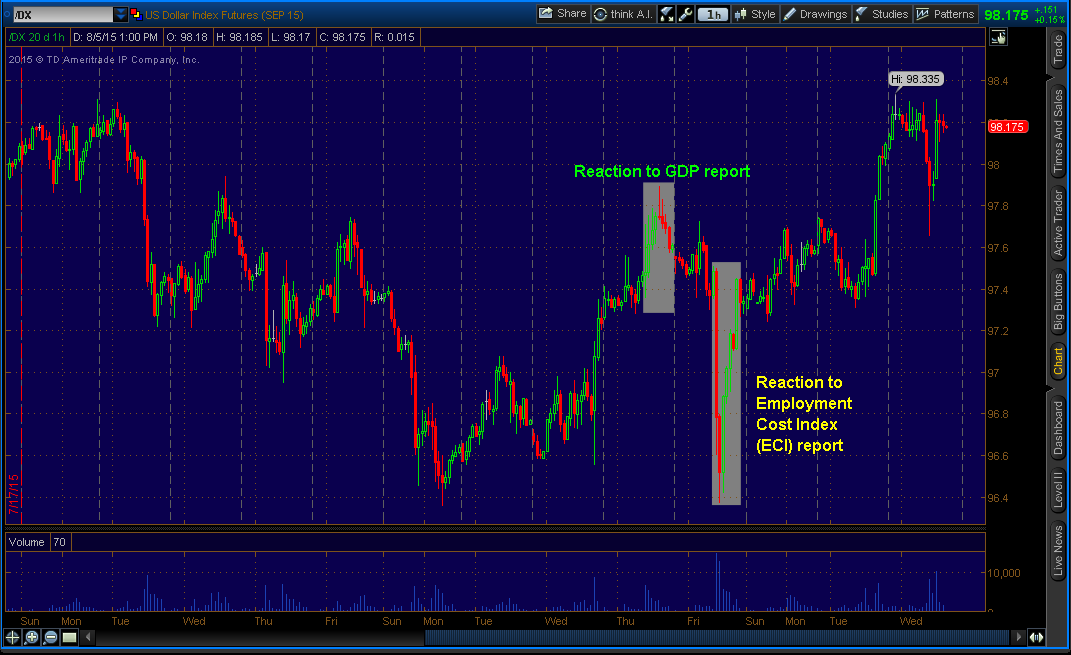
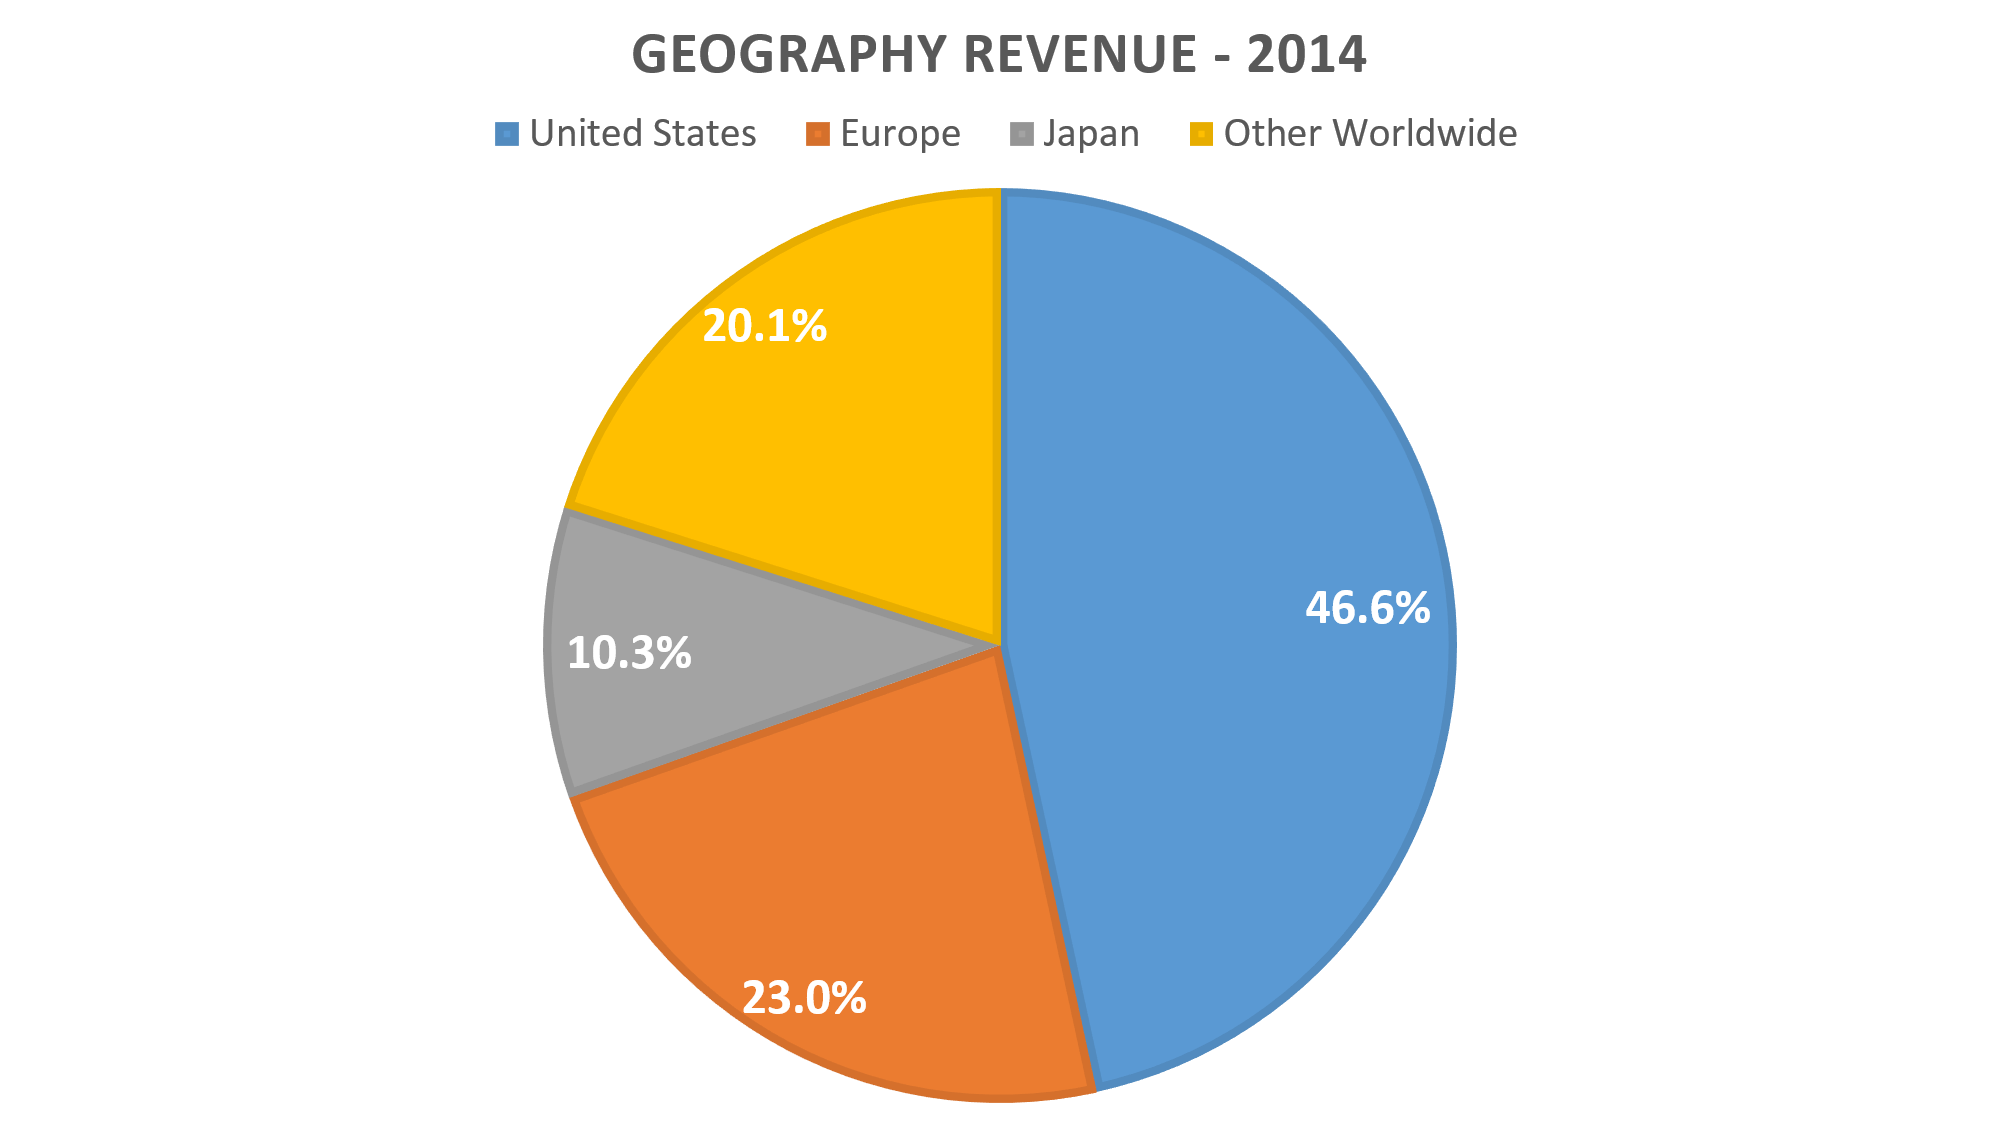
Strong U.S. dollar is an issue for Eli Lilly. Over the past five years, the dollar index increased 26.75%. Last quarter, its 49.2% of revenue came from foreign countries. Its revenue in the U.S. increased 14% to $2.54 billion, while revenue outside the U.S. decreased 9% to $2.42.
Eli Lilly’s dividend yield of 2.55% or 0.50 cents per share quarterly can be attractive, but it is undesirable. From 1995 through 2009 (expectation of 2003-2004), Eli Lilly raised its dividend. Payouts of $0.26 quarterly in 2000 almost doubled to $0.49 in 2009. Then, the company kept its dividend payment unchanged in 2010, the same year when its net-income, EBITDA and earnings per share (EPS) reached an all-time high. About four years later (December 2014), Eli Lilly increased the dividend to $0.50 quarterly. I still don’t see a reason to buy shares of Eli Lilly. The frozen divided before the recent increase was a signal that the management did not see earnings growing. With expected patent expiration of Cymbalta, their top selling drug in 2010, it is no wonder Eli Lilly’s key financials declined and dividends stayed the same. Cymbalta sales were $5.1 billion in 2013, the year its patent expired. In 2014, its sales shrank all the way down to $1.6 billion. Loss of exclusivity for Evista in March 2014 immensely reduced Eli Lilly’s revenue rapidly. Sales decreased to $420 million in 2014, followed by $1.1 billion in 2013. Pharmaceuticals industry continues to lose exclusivities, including Eli Lilly.
In December 2015, Eli Lilly will lose a patent exclusivity for antipsychotic drug Zyprexa in Japan and for lung cancer drug Alimta in European countries and Japan. Both of the drugs combined accounted for revenue of $866.4 million in the third-quarter, or 17.5% of the total revenue. They will also lose a patent protection for the erectile dysfunction drug Cialis in 2017, which accounted for $2.29 billion of sales in 2014, or 11.68% of the total revenue.
Besides the pressure from patent expirations, there is also regulatory pressures on drug pricing. According to second-quarter 10Q filing, Eli Lilly believes “State and federal health care proposals, including price controls, continue to be debated, and if implemented could negatively affect future consolidated results of operations.” During the third-quarter earnings call, CEO of Eli Lilly, John C. Lechleiter, said that price increases reflects many of medicines going generic and “deep discounts” government mandates for large purchasers.
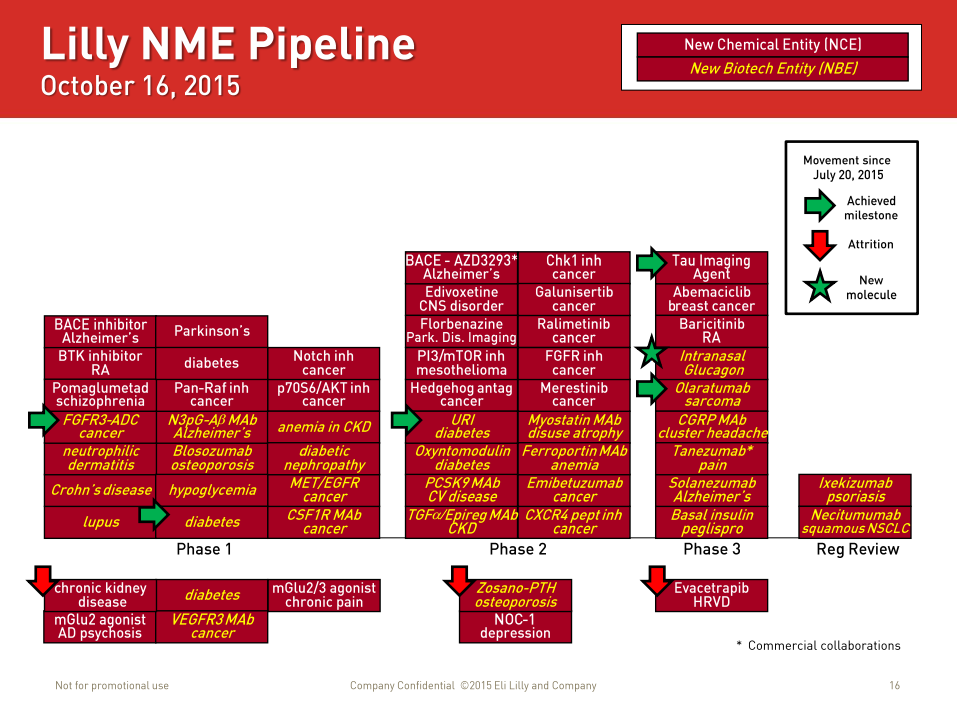
As of October 16, Eli Lilly had two drugs under regulatory review, nine drugs in Phase 3 testing, and 18 drugs in Phase 2 testing. Since the end of July, the drug maker terminated the development of few drugs, including evacetrapib in Phase 3, two drugs in Phase 2, and five in Phase 1. Out of total eight drug termination, only five drugs moved to the next stage of testing. I view the recent termination of evacetrapib as a major setback.
Compared to its peers, LLY’s Price-to-Earnings ratio is too high. Its P/E ratio (on GAAP basis) stands at 38.22 while industry average stands at 17.7. Four of its main peers, Pfizer (PFE), Johnson & Johnson (JNJ), Merck (MRK), and Sanofi (SNY) P/E ratio stands at 24.08, 19.63, 14.41, and 22.38, respectively.
Negative trends, tighter regulations, increasing competition and slowing growth makes Eli Lilly’s current valuation unjustified. I believe it will reach an average P/E ratio of its four main competitors, at 20.12, in the next three years. I expect EPS (GAAP) to contract. With current EPS of $2.21 (LTM, GAAP) and P/E ratio of 20.12, share price would be worth $44.46, down 47.37% from current share-price of $84.47. As EPS contracts, the share price of Eli Lilly will be much further down from $44.46 in the next three years.
Disclosure: I’m not currently short on the stock, LLY, at this time (October 21, 2015).
Note: All information I used here such as revenue, margins, EBITDA, etc are found from Eli Lilly and Company’s official investor relations site, Bloomberg terminal and morningstar. The pictures you see here are my own, except “Eli Lilly Pipeline – Third Quarter Earnings Presentation – Page 16”
Disclaimer: The posts are not a recommendation to buy or sell any stocks, currencies, etc mentioned. They are solely my personal opinions. Every investor/trader must do his/her own due diligence before making any investment/trading decision.