Last Thursday (July 30, 2015), the Bureau of Economic Analysis (BEA) released its advance (1st estimate out of 3) of Gross Domestic Product (GDP) for the second quarter (April, May and June) of the year. It was positive enough to increase the chance of rate-hike in September significantly.
Before we go any further, let’s review what two types of GDP, nominal-dollar terms and real-dollar terms. Current (or nominal-dollar) GDP tallis the value of all goods and services produced in the U.S. using present prices. On the other hand, Real (or chained-dollar) GDP counts only the value of what was physically produced. To clarify the point, suppose a hat-making factory announces that it made $1 million selling hats this year, 11% more than last year. The $1 million represents nominal company sales (or current dollar). However, something is missing. From this future alone, it’s unclear how the factory achieved the extra income. Did it actually sell 11% more hats? Or did it sell the same number of hats as the year before but simply raised prices by 11%? If the factory made more money because it increased the price tag by 11%, then in real (constant-dollar) terms, the true volume of hats sold this year was no greater than last year, at $900,000.
It’s vital to know if the economy grew because the quantity of products sold was greater or whether it was largely the result of price hikes, or inflation. (Source: “The Secrets of Economic Indicators” by Bernard Baumohl)
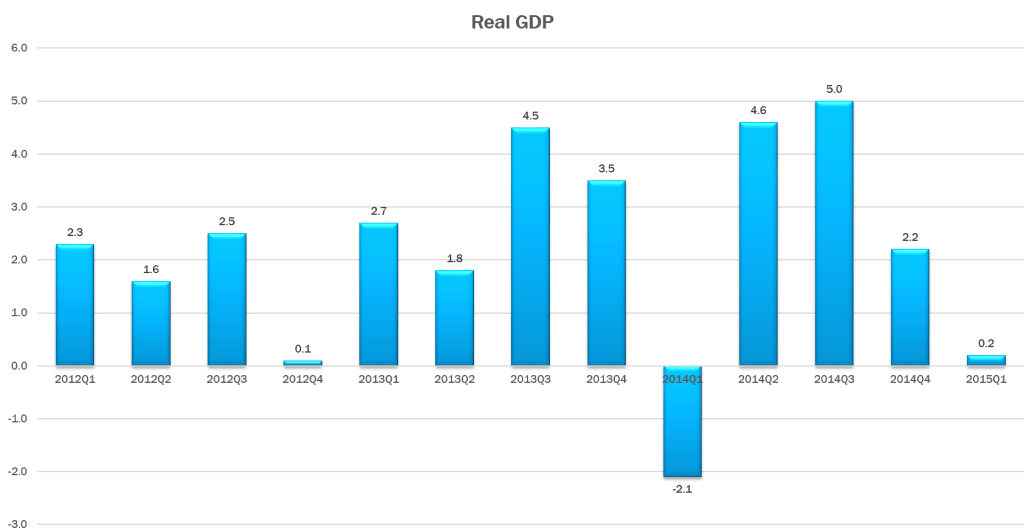
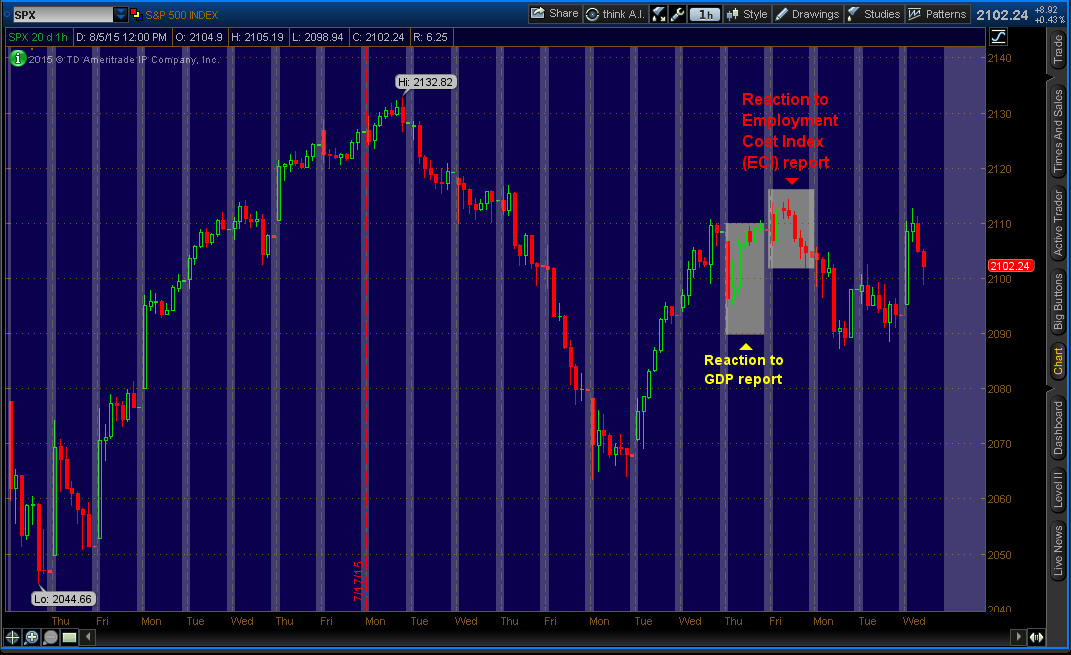
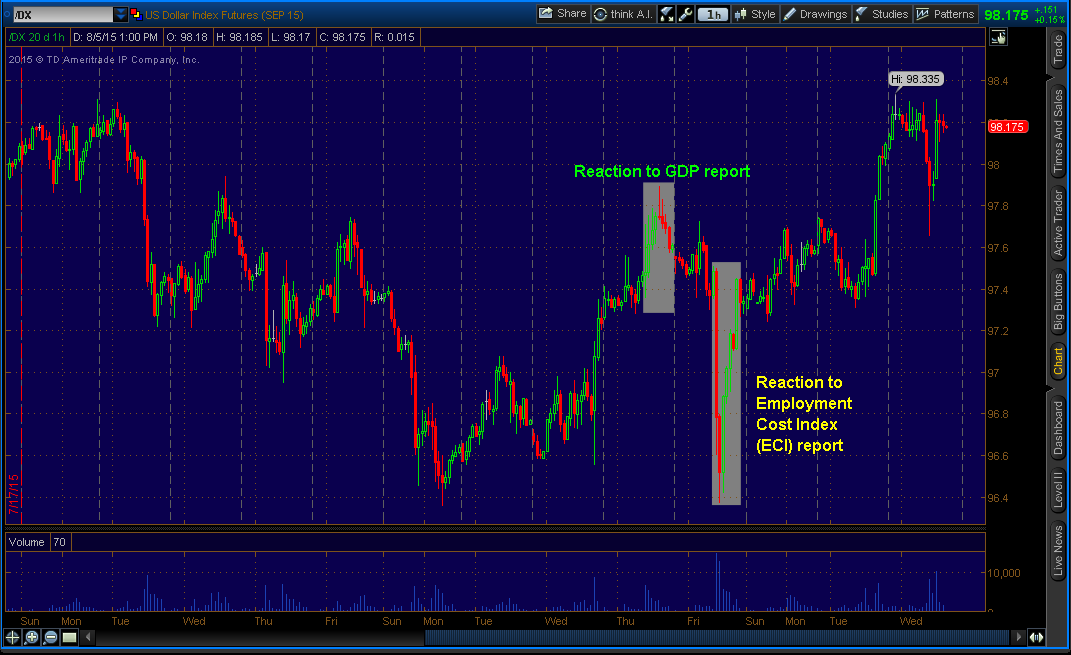
Real GDP increased at a annualized rate of 2.3%, vs expectations of 2.5%. This is a major acceleration from the first quarter when real GDP increased 0.6% (expansion), revised from -0.2% (contraction). The economy bounced back after a slow start in the beginning of the year.
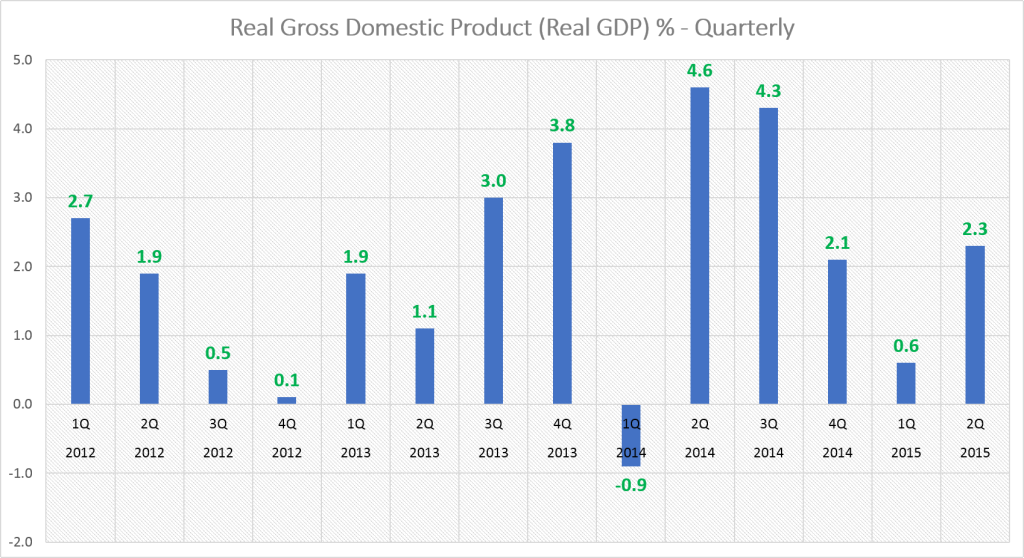
In the beginning of the year, US economy was hurt, or “walked backwards” due to unfavorable weather, lower energy prices, West Port strike, and stronger dollar. While, the economy has moved beyond the weather and west port strike, – a strong dollar, and lower energy prices will continue to limit growth.
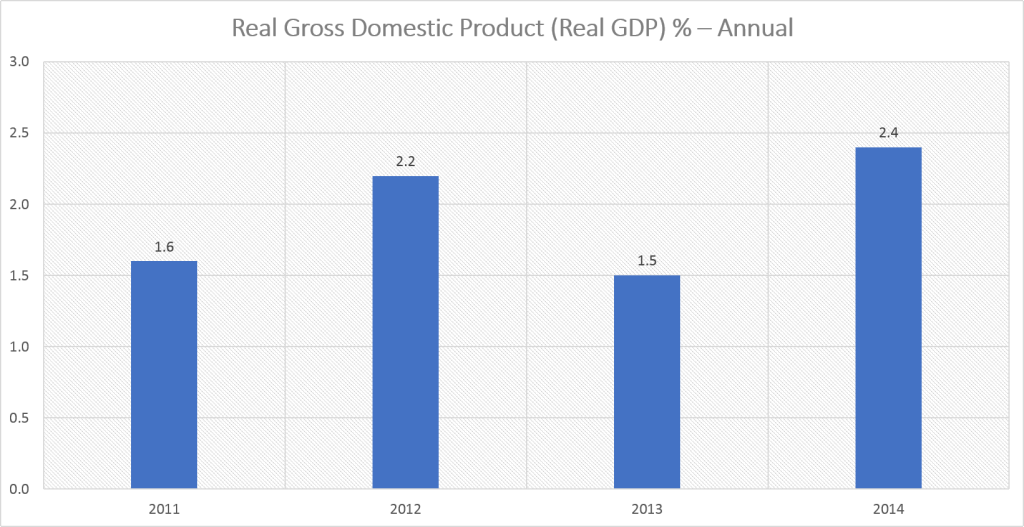
While first quarter was revised upwards, 2011-2014 was revised lower. The economy grew 1.6% in 2011, down from the 2.3% initial reading; 2.2% in 2012, up from the 1.5% initial reading; 1.5% in 2013, down from 1.7%; and 2.4% in 2014, down from 2.7%. From 2011 to 2014, growth was essentially weaker. The economy expanded by an average annual rate of 2%, below initial reading of 2.3%.
Growth in the second quarter was boosted by consumer spending. Consumer spending grew at a 2.9% rate from a 1.8% in the first quarter. That is a very good sign because real personal consumption expenditures (PFE) AKA consumer spending, accounts for 70% of total GDP. If people are not spending, it spells serious trouble for the economy.
Real exports increased 5.3% in the second quarter, compared to 6% fall in the first quarter. First quarter’s significant drop was due to west port slowdown. The strong dollar has hurt exports but its effects have eased recently…for now. Port delays in the first quarter freed up exports and temporarily increased exports.
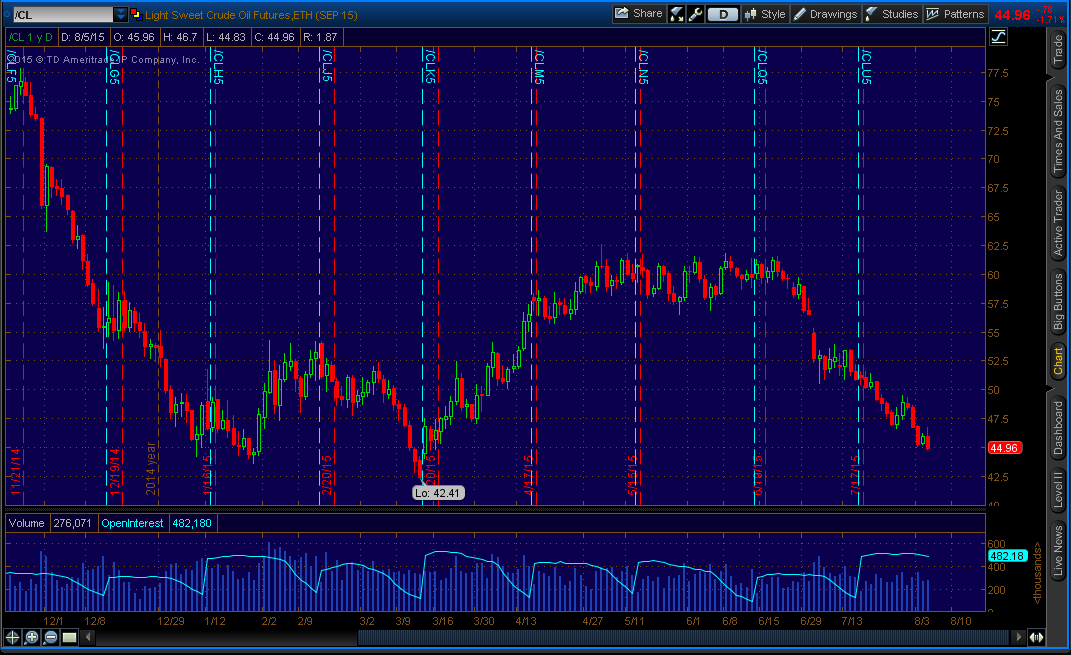
Business investment fell 0.6% in the second quarter, from previous 1.6% increase in the first quarter, as energy companies continue to scale back projects amid low oil prices.
Recently, crude oil prices have fallen back to the Earth. On Monday, August 3, crude oil prices hit just above $45 (currently below $45). It will continue to hurt energy companies, causing them to scale back projects and lay-offs. Low gasoline prices, however, would lead consumers to spend money. It’s better to pay off debts first before spending money on “wants”.
On Friday (July 31, 2015), Employment Cost Index (ECI) report for the second quarter was released and it was disappointing.
ECI, a broad measure of workers’ wages and benefits, increased 0.2%, smallest gain since records began in the second quarter of 1982, following 0.7% increase in the first quarter. Wages and salaries, which accounts of 70% of compensation costs, also increased 0.2% in the second quarter, the smallest gain on record.
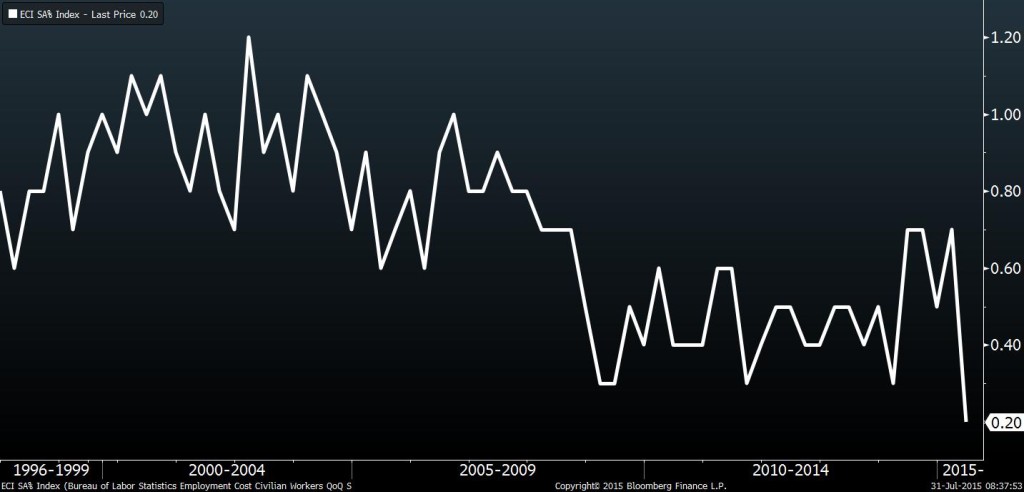
The report suggests that slack remains in the labor market. The unemployment rate fell to 5.3% in June – the lowest level since April 2008 – close to the Fed’s target of 5% to 5.2%, which the Fed policy makers consider consistent full employment.
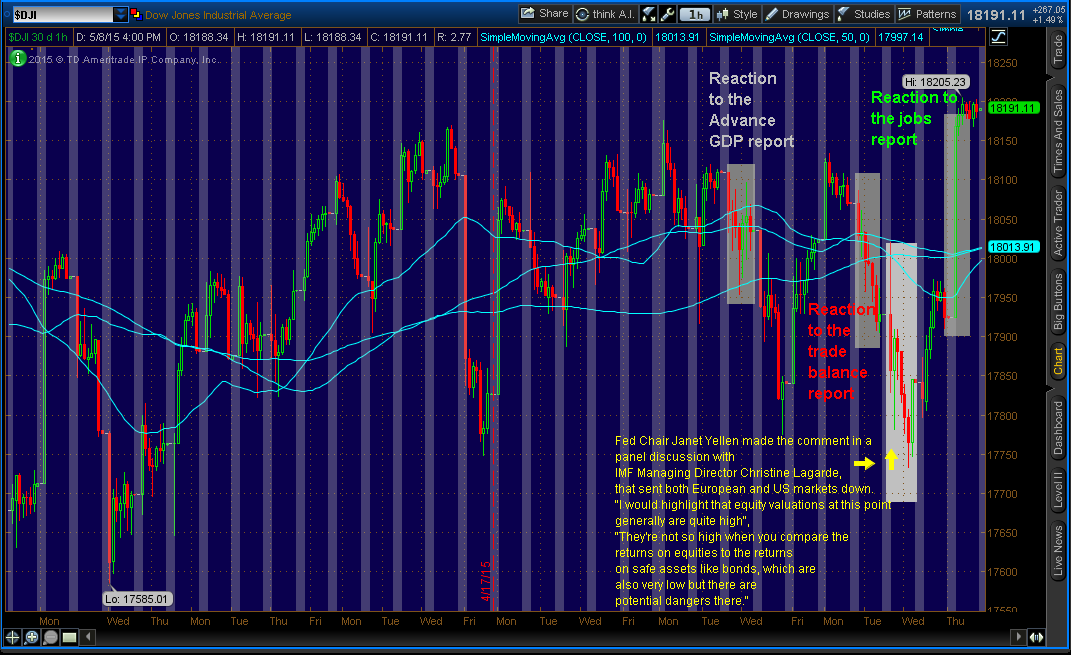
S&P 500’s reaction to both GDP and ECI reports.
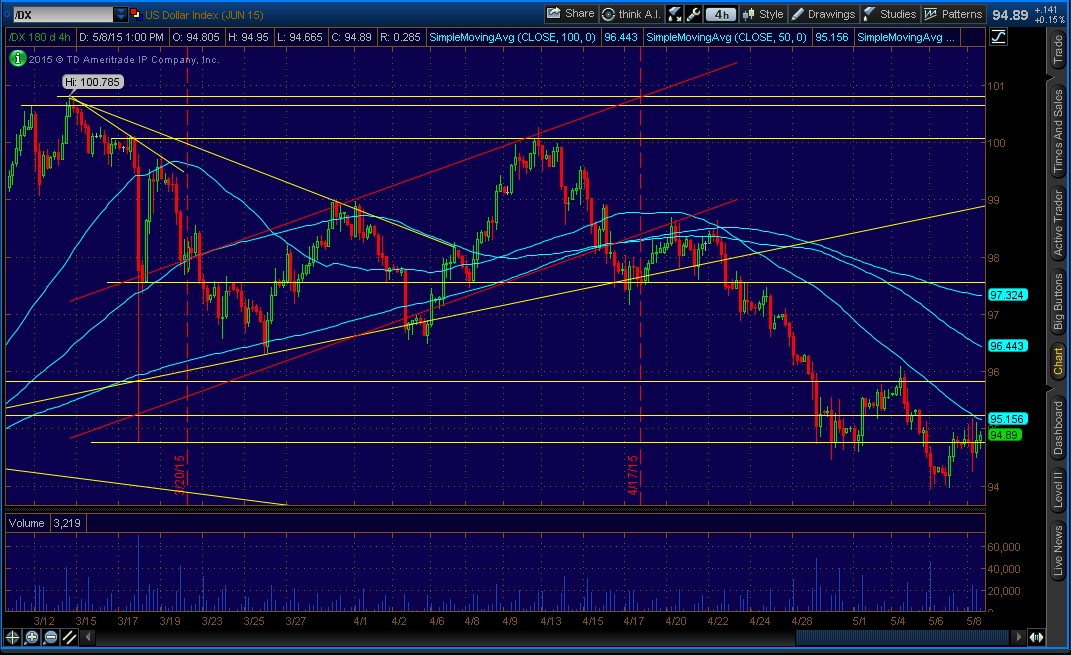
Dollar’s reaction to both GDP and ECI reports.
The Federal Reserve are counting on rising wages to boost both the economy and inflation (2% target). On Wednesday, July 29, the Fed said it won’t start lifting rates until there is “some further improvement in the labor market and is reasonably confident that inflation will move back to its 2 percent objective over the medium term.”
The Fed is monitoring employment, inflation, and wages closely as it moves to closer to raising interest rates from near zero, for the first time since the recession. Raising rates too soon or too late can have its consequences.
The Fed will meet on September 16 and 17. I still believe the Fed will raise rates. If employment, inflation and wage reports are not very strong until September meeting, the Fed might raise the rates by little as 0.10% (10 basis points), instead of 0.25%.
I believe the disappointment of ECI is temporary as more companies are starting to increases wages and more people are slowly entering jobs market. I also believe that GDP continues to be strong. In fact, I believe current Q2 GDP will be revised higher. Preliminary (2nd estimate) of Q2 GDP will be released on Thursday, August 27.
On Friday (August 7), important reading data of US economy will be released, non-farm payrolls AKA jobs report. My guess for employment and unemployment rate is 285K and 5.4%, respectively. I believe wages will stay flat at this time and accelerate in the next few months.
I will take advantage of any pullback in the greenback (US Dollar). Greenback has a room to strengthen more. Currency pairs such as USD/JPY, USD/CAD, I would be long, and I would be short EUR/USD. If you have any questions, feel free to contact me and/or leave comments below. Thank you.


