War is Good for the Cold-Hearted Stock Market

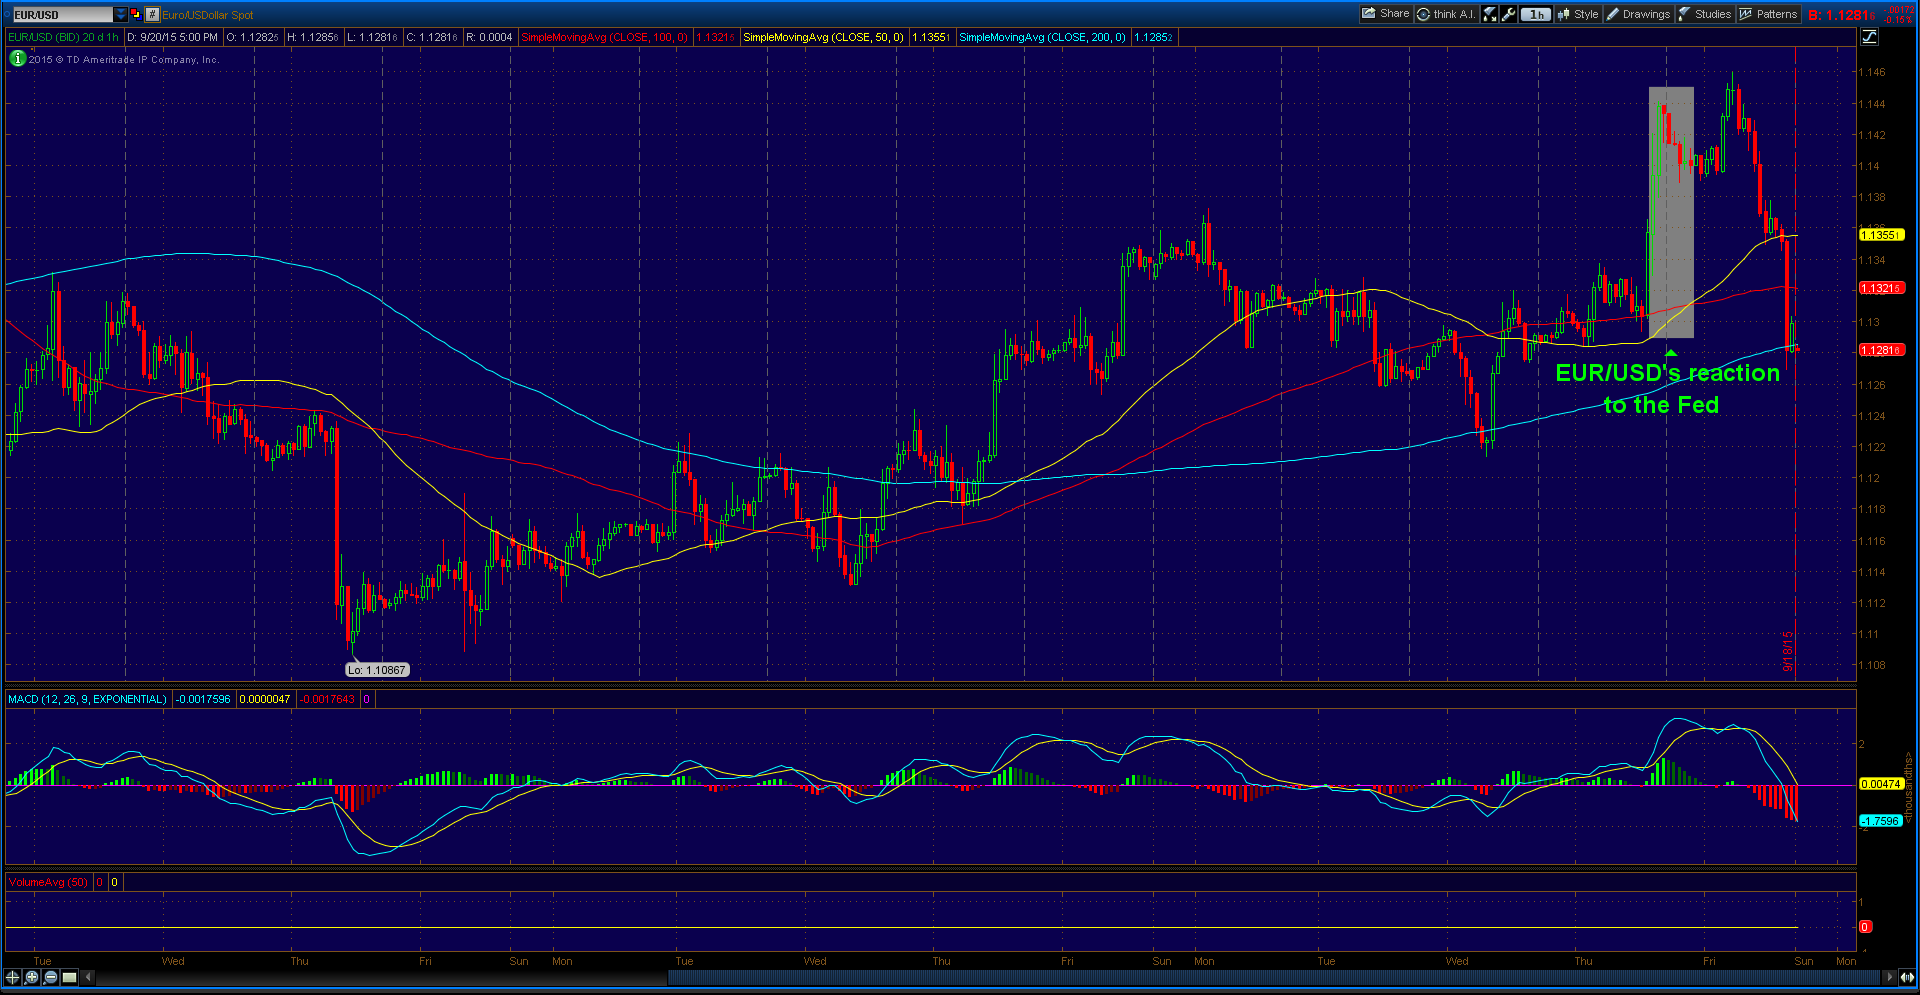
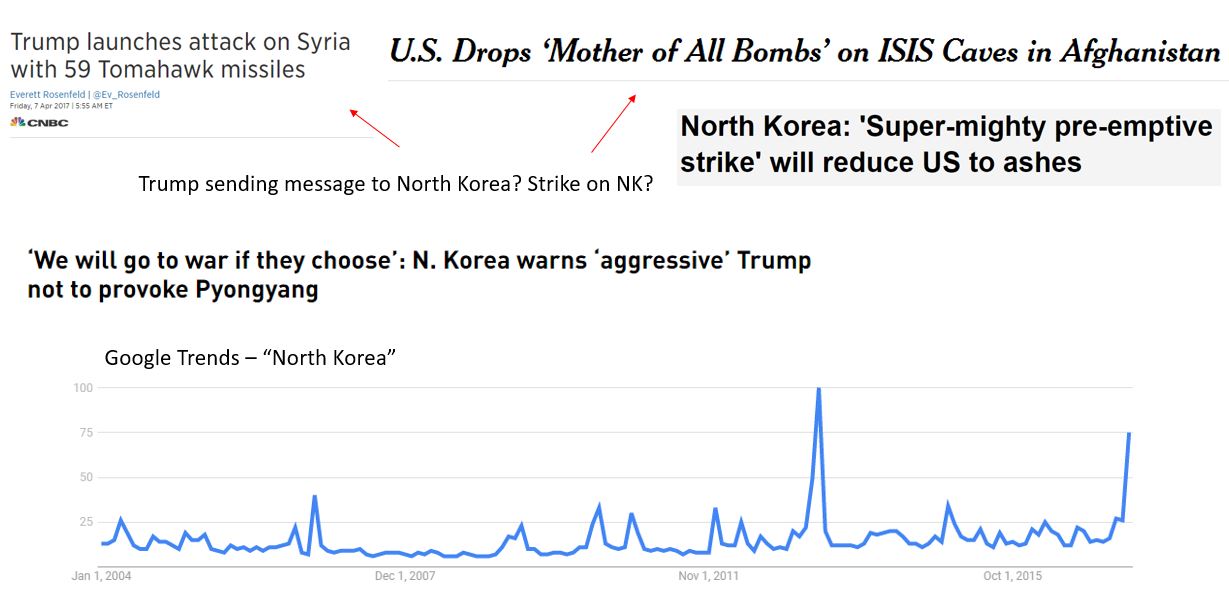
Look at the headlines.

Figure 1: Trump Military Headlines. Google Trends – “North Korea”

At 17-years-old, Donald Trump was named a captain for his senior year at a military boarding school. Spending five years at New York Military Academy, the school taught Trump to channel his aggression into achievement.

Under the Trump budget, almost every budget increase goes to military departments, 10% increase Y/Y in the budget for military spending. It’s not a rocket science to figure out Trump madly loves force.

Even Trump’s Secretary of Defense loves force. Mad Dog James Mattis once said, “It’s fun to shoot some people. I’ll be right up there with you. I like brawling.”

At his confirmation hearing in January, Mattis said, “My belief is that we have to stay focused on the military that is so lethal that on the battlefield, it is the enemy’s longest day and worst day when they run into that force.”

Then there came 59 Tomahawk missiles to military bases in Syria and “Mother of All Bombs” on Daesh tunnels in Afghanistan. All of those came during the heightened tensions with North Korea.

War is Good for the Cold-Hearted Stock Market

North Korea acting out is a good thing for America. War throughout the history has made us united. Not to mention that the stock market goes up.

Figure 2: S&P 500 Index (SPX) – Daily Chart.
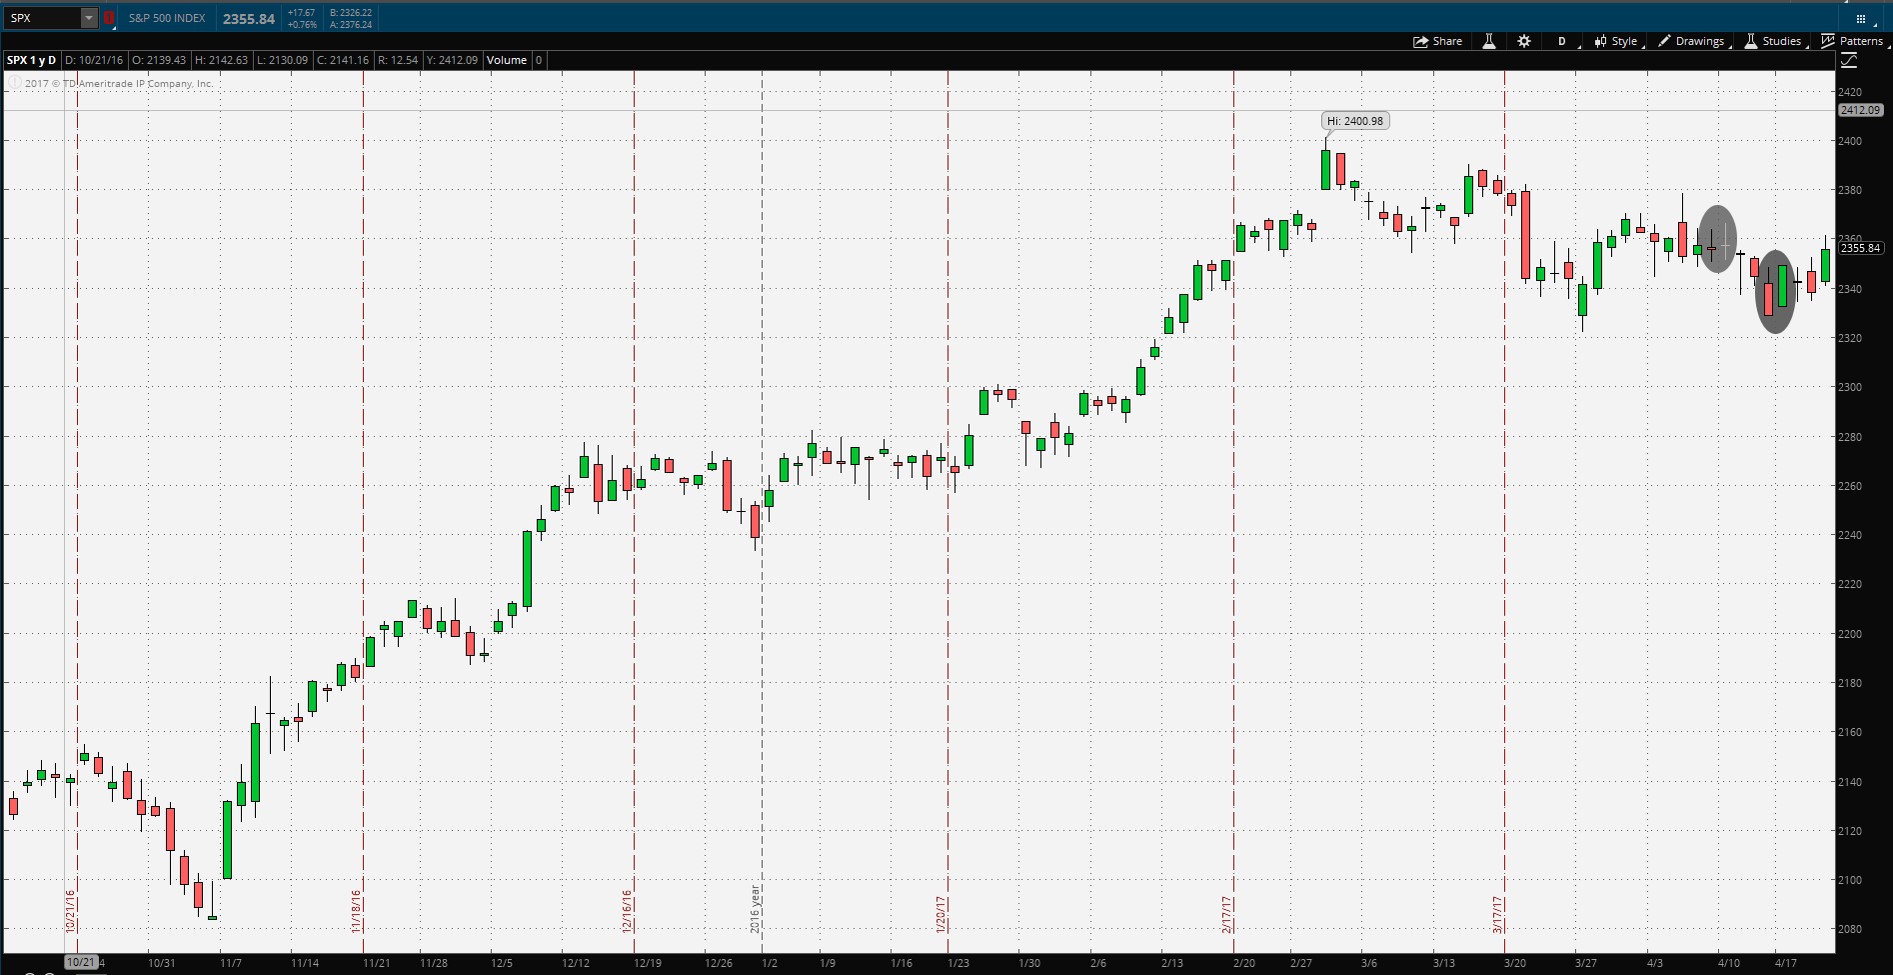
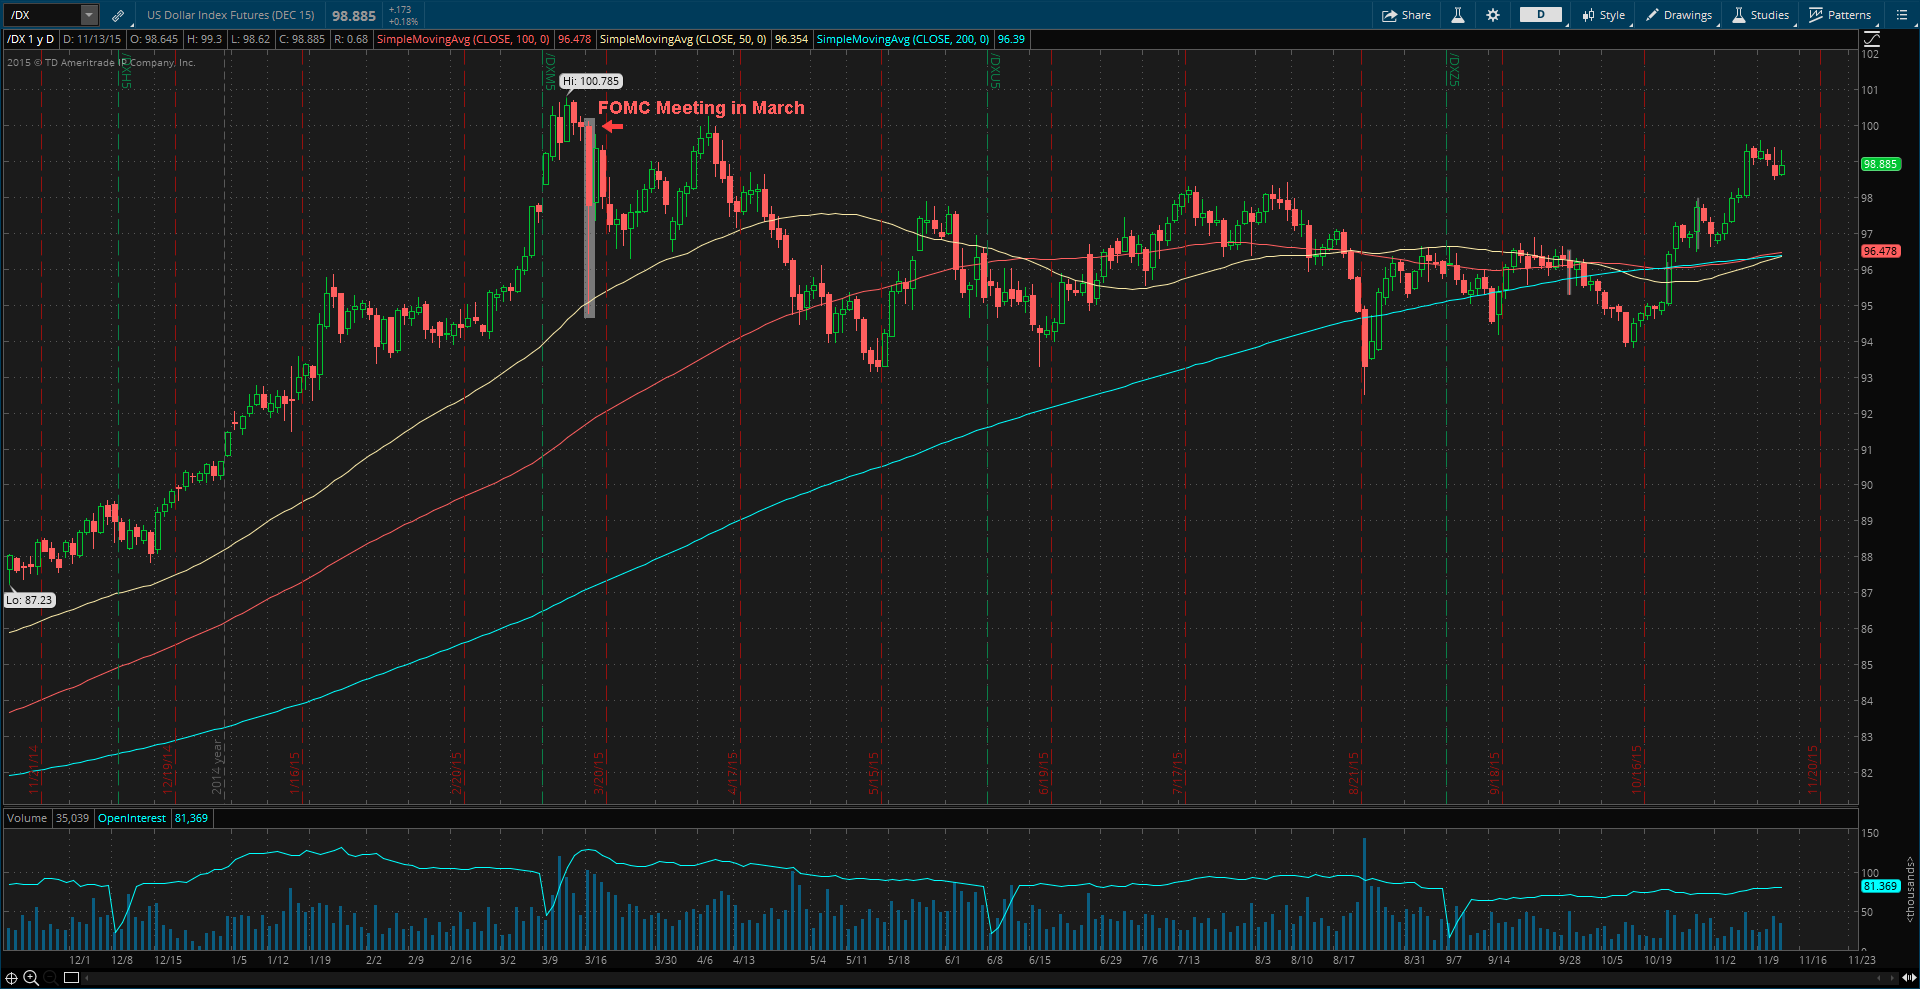
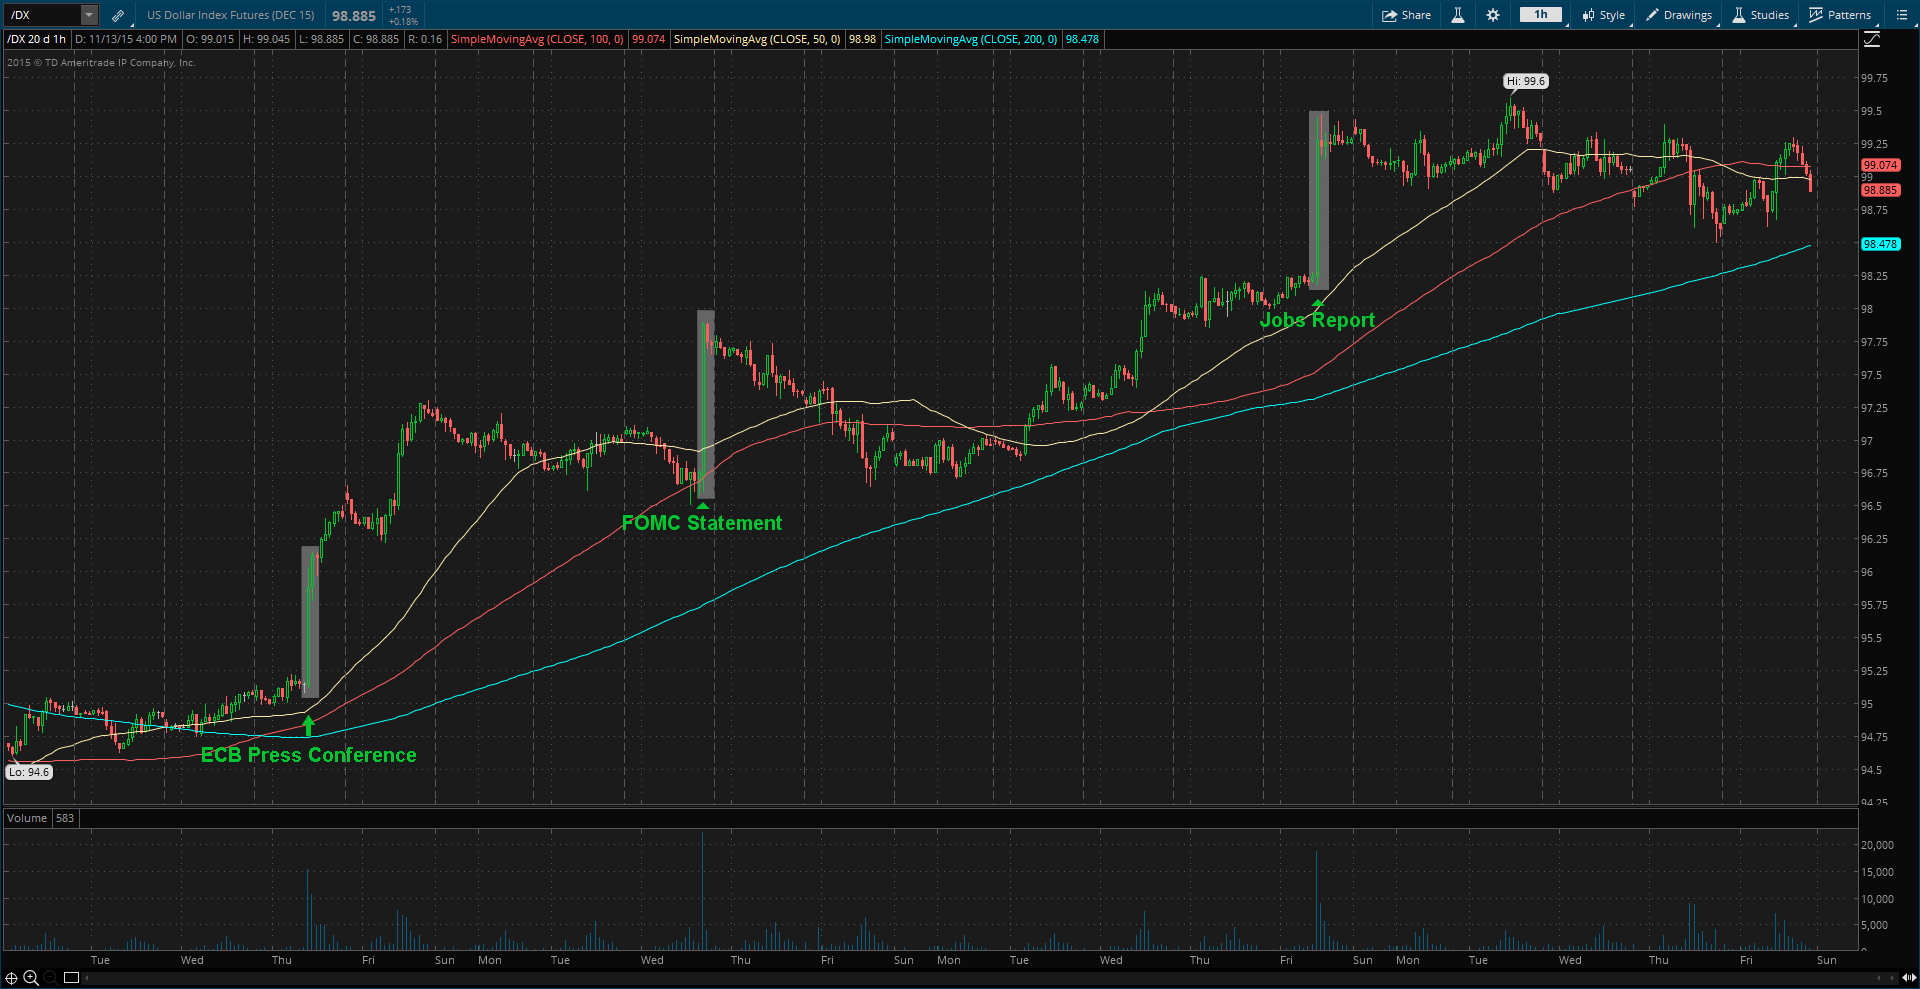
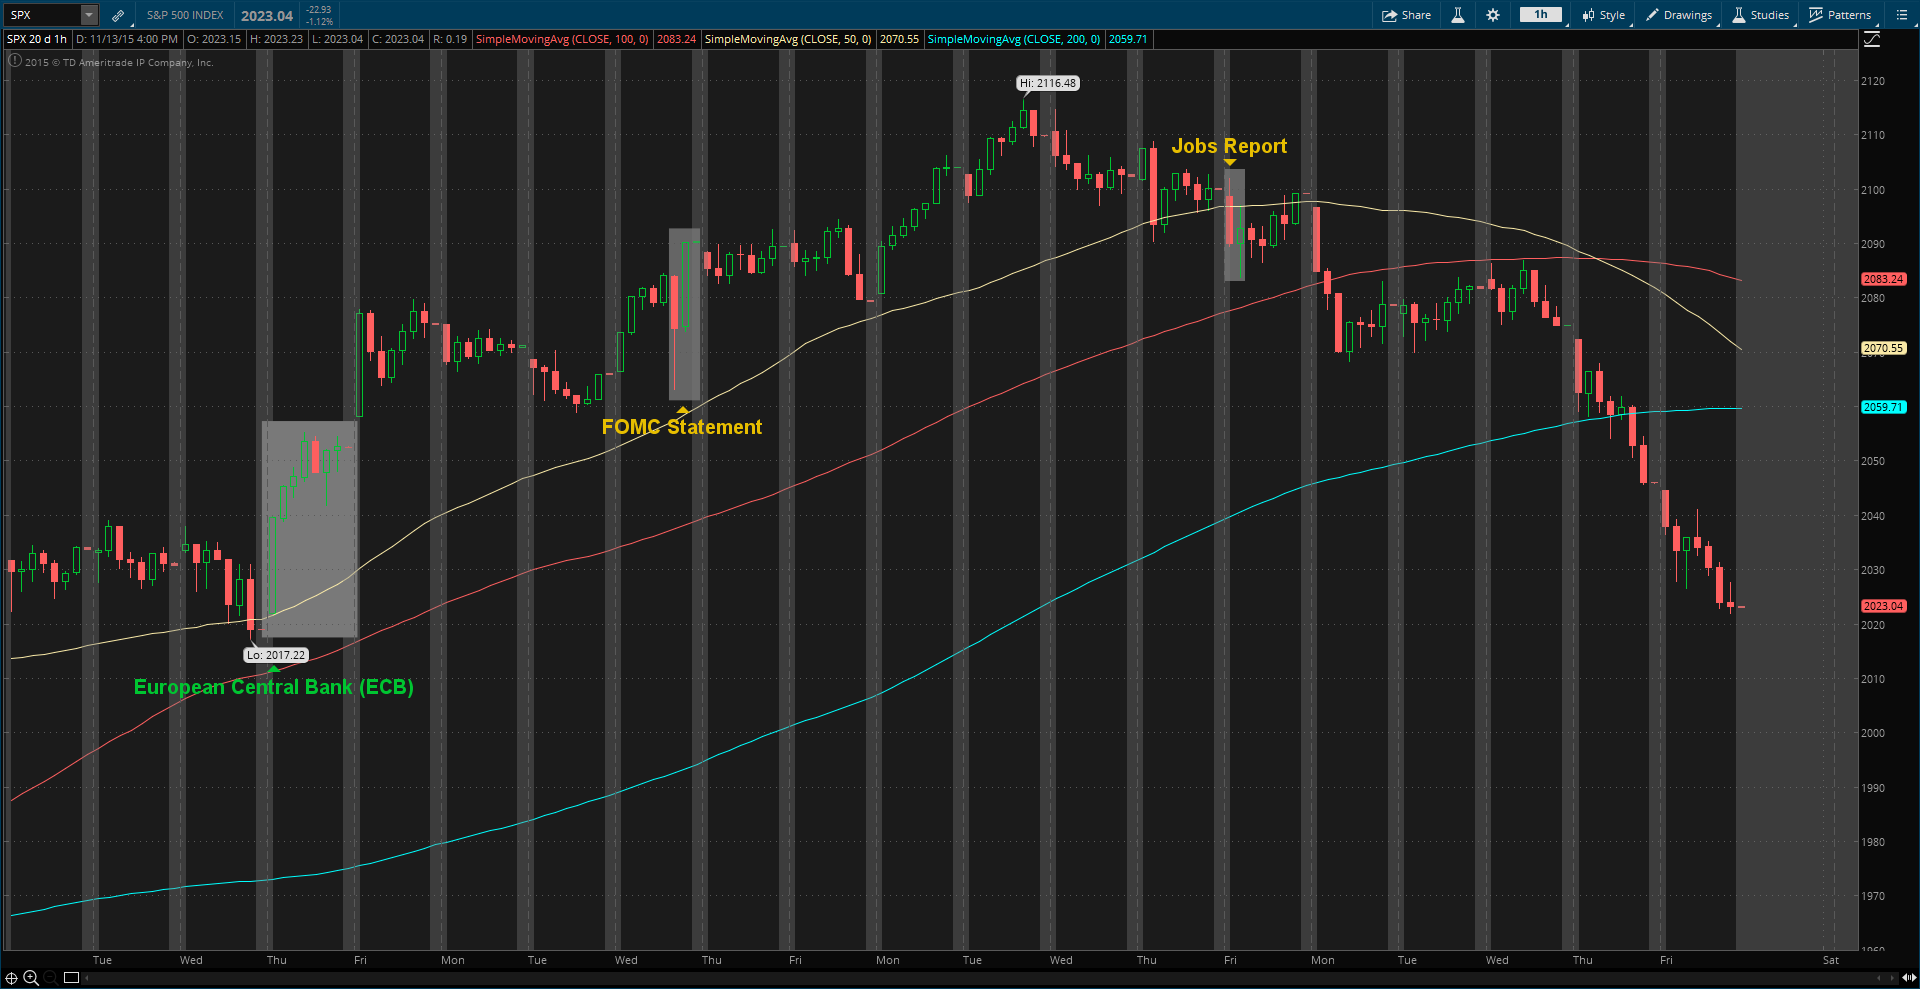
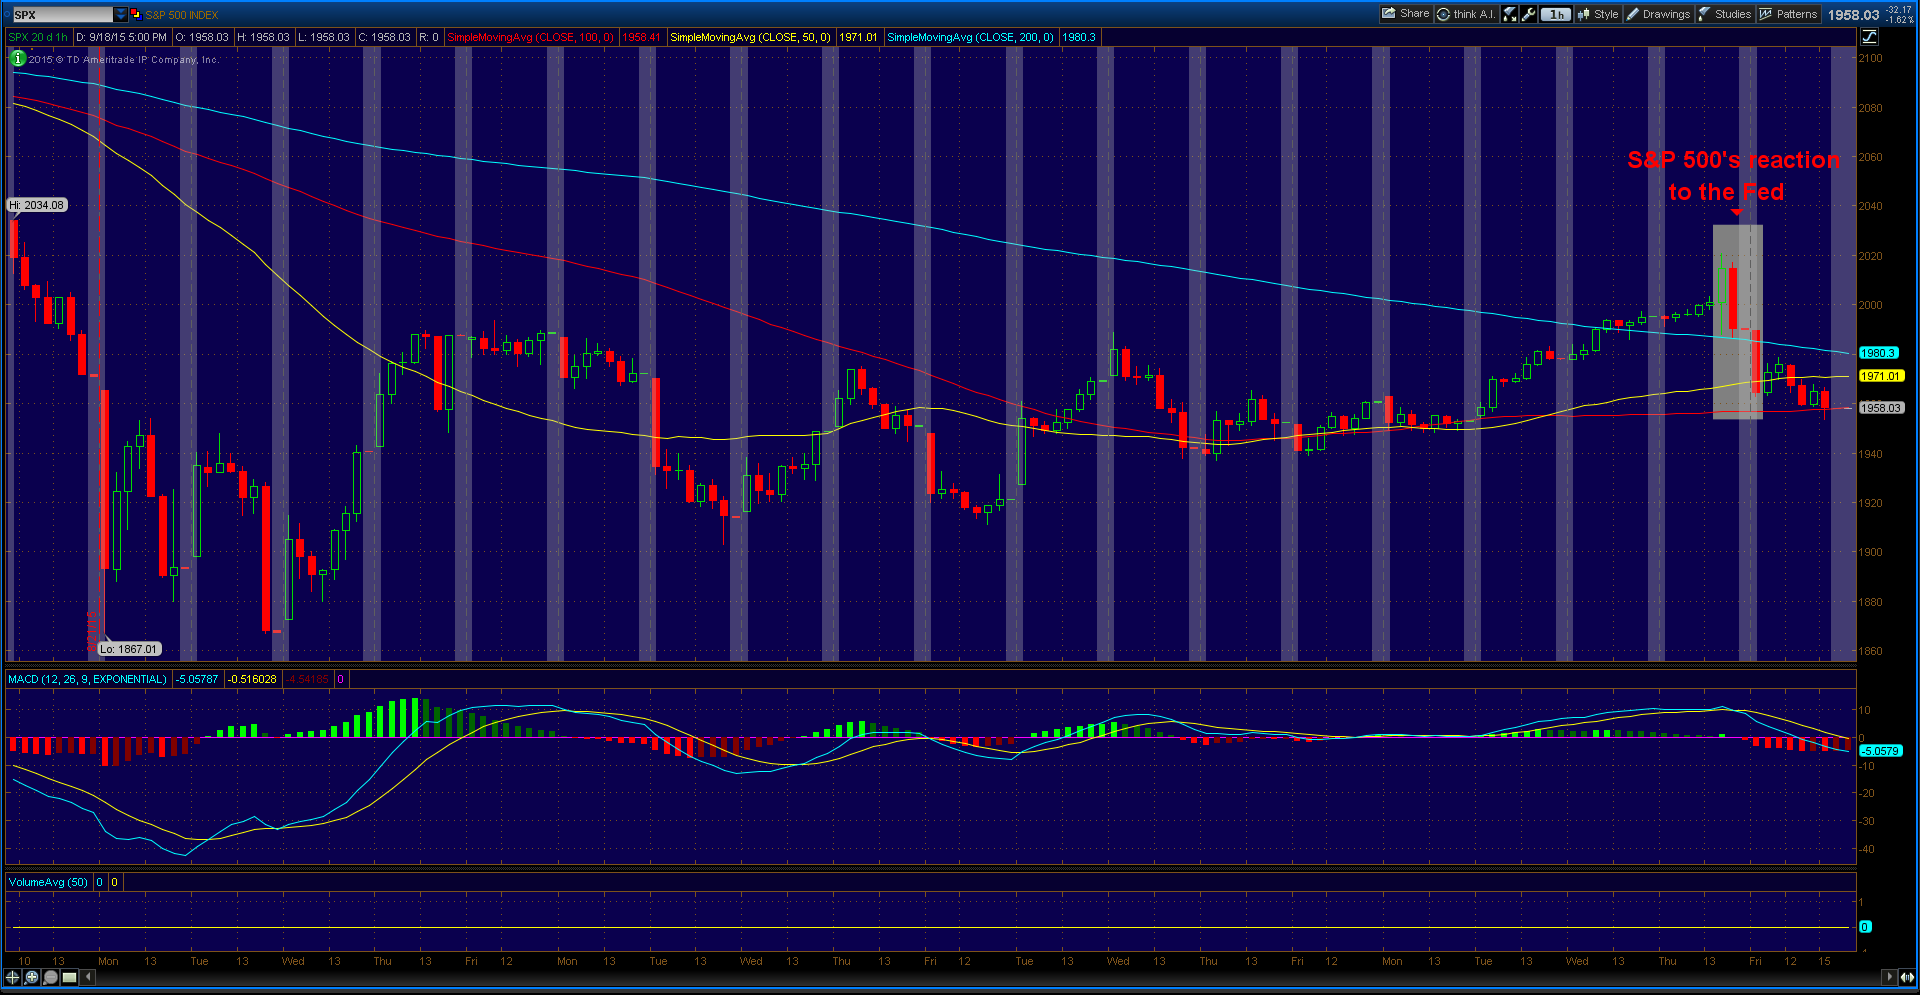
The first circle represents the time of news reports on U.S. airstrikes on Syrian bases.
The second circle represents the time of news reports on most powerful non-nuclear bomb being dropped in Afghanistan

As you can see in figure 2, the stock market barely reacted to the recent U.S. military actions that Trump gave a green light to.

As a trader and investor, I wouldn’t be concerned about the potential war with North Korea. (Although I would be concerned about the loss of human lives and loss of limbs.)

In early 2013, there were increased tensions with North Korea, similar to today. At the time, the stock market did not give a damn about the threats from DPRK.

Figure 3: S&P 500 Index – Daily
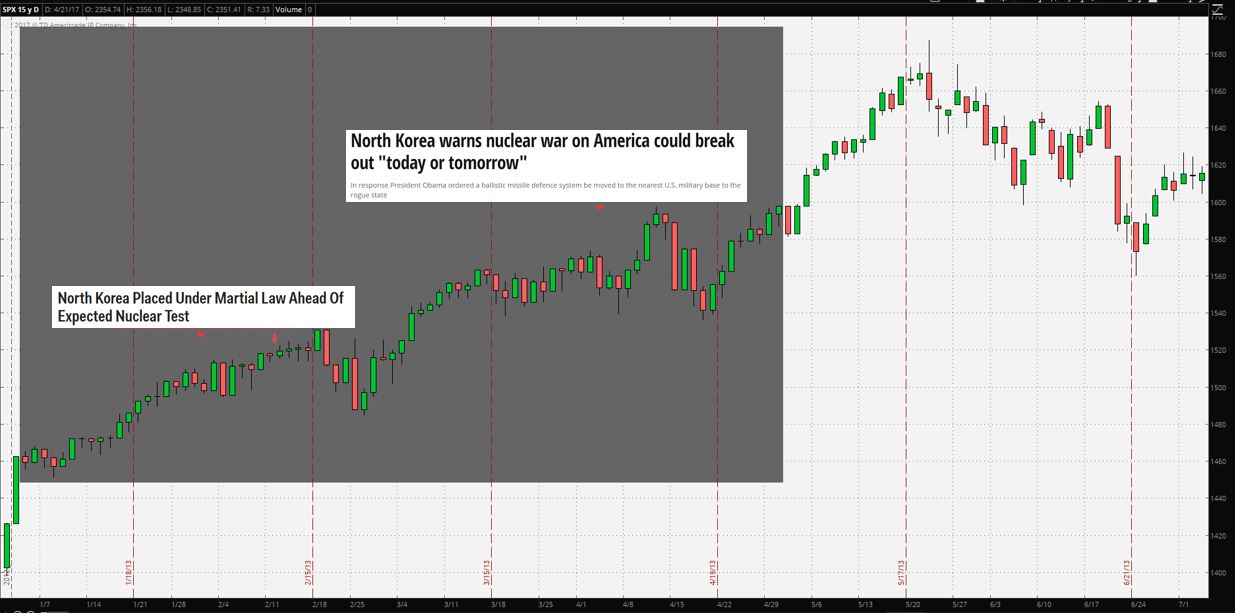
The first headline shows two arrows.
The first arrow represents when the headline came out. The second arrow represents February 12 when NK conducted the nuclear test.
The second headline represents North Korea threatening the west as usually.

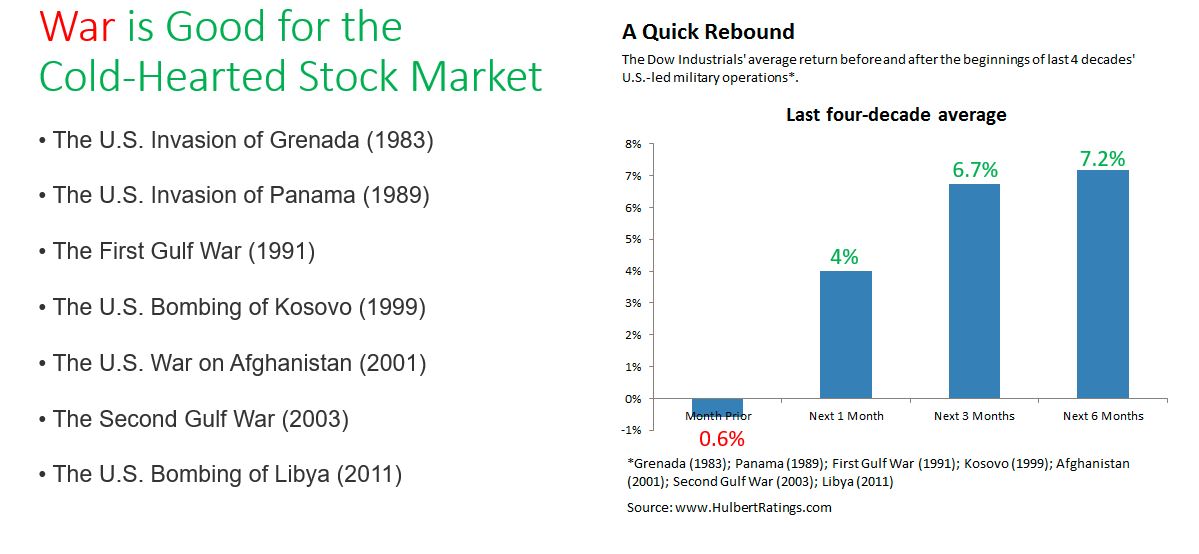
Not only does the stock market not care about North Korea, but also for any other war in the past century. War is good for the cold-hearted stock market.

Over the past 4 decades, Dow Industrials on average was turned on by U.S.-led military operations, returning 4% in a month after the beginning of military operations and more afterward.

Figure 4: War is Good for the Cold-Hearted Stock Market
Recent Three Wars

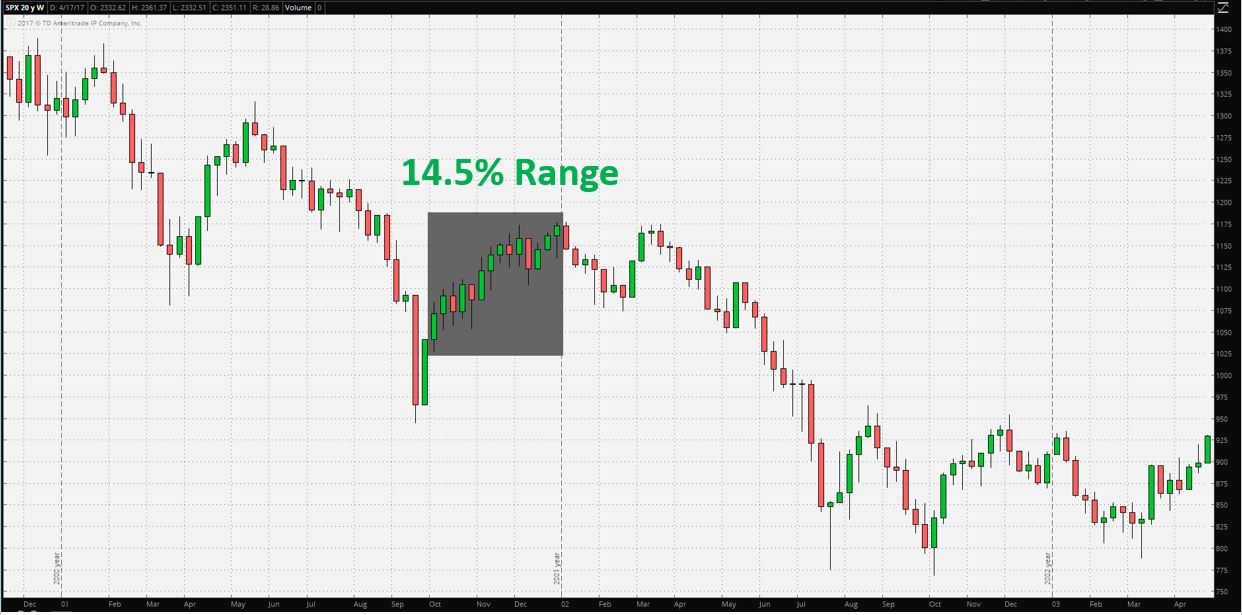
When the U.S., with support from allies, started bombing against Taliban forces in Afghanistan on October 7, 2001, the stock market went up, not down. Even after 12 days later when the first wave of conventional ground forces arrived, the stock market kept going up. By the year-end when Taliban collapsed, S&P 500 was up about 14.5%.

Figure 5: S&P 500’s reaction to the U.S. military action in Afghanistan – Weekly Chart

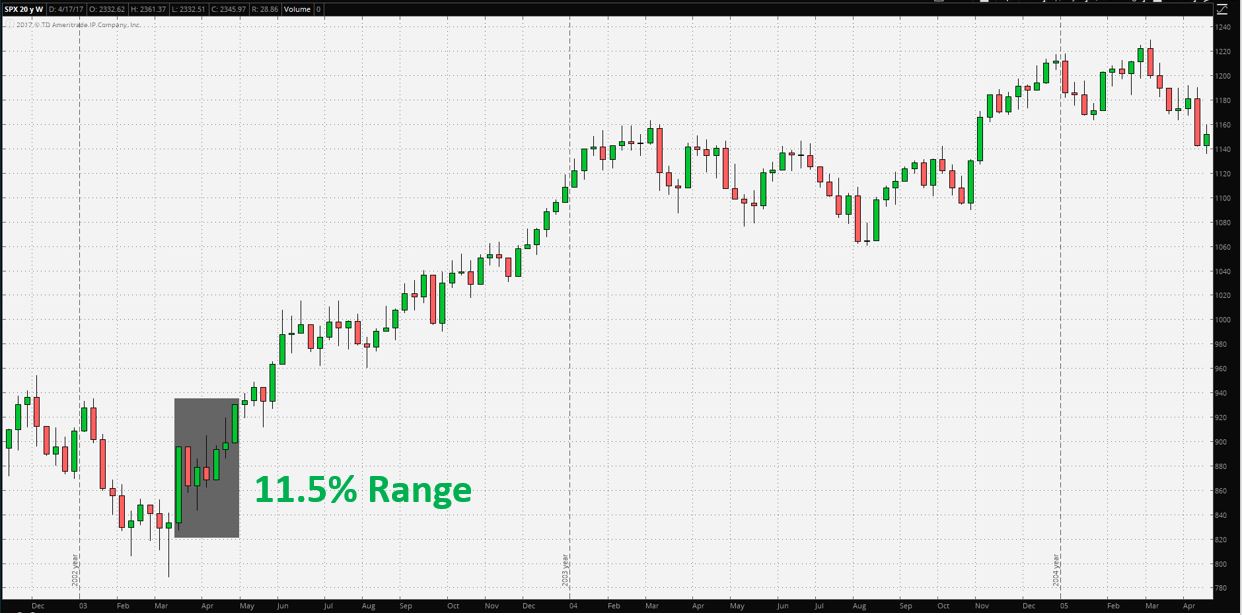
When the U.S. began the major combat operations in Iraq on March 20, 2003, the stock market skyrocketed as shown in the candlestick bar on the highlighted portion of S&P 500 Weekly chart in figure 6 below. By the time the operations ended on May 1, the stock market was up about 11.5%.

Figure 6: S&P 500’s reaction to the U.S. military action in Iraq – Weekly Chart

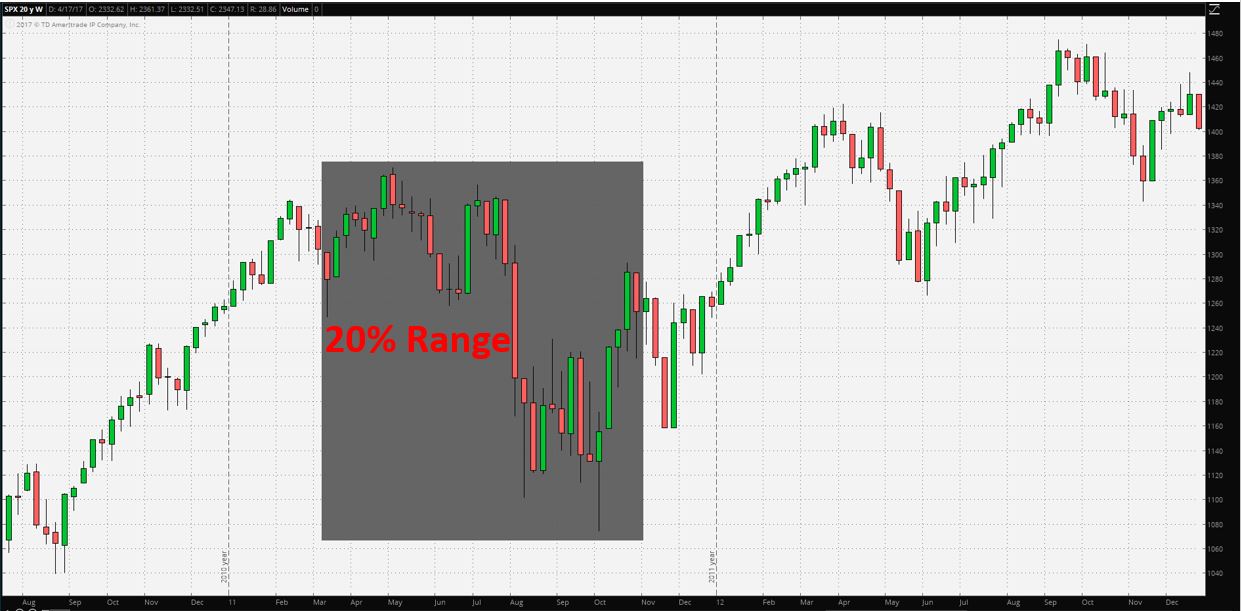
On March 19th of 2011, multiple countries part of NATO intervened in Libya. By the end of intervention on October 31st, the market slid 20%. The drop cannot be blamed on the NATO-led forces. This was due to the fears of contagion of the European debt crisis and first-ever downgrade of U.S. AAA credit rating.

Figure 5: S&P 500 reaction’s to the U.S. military action in Libya – Weekly Chart

The only difference this time is we got leaders who very much loves forces and are violent themselves. Another difference is that North Korea is little powerful today than they were in 2013. But they are very weak compared to China, Russia, Europe, and U.S. It’s better to act now before North Korea gets even stronger. Although lives and limbs will be lost, I think there’s a greater cost if we allow North Korea to get even stronger.

China and North Korea

With China possibly increasingly going against North Korea, Kim Jong-un might act even more violent. I don’t think China really wants to break off its relationship DPKR due to the geographic proximity and China’s willingness to make more friends in the region. Besides being a military and diplomatic ally, China is also an economic ally. In 2015, the second largest economy accounted for 83%, or $2.34 billion, of the North Korea’s exports.

In late February, China sanctioned coal shipments from North Korea, who is a significant supplier of coal. Instead, China has been ordering the coal from the U.S. In the past, Trump said he wants to help the country’s struggling coal sector.

As Reuters reported, Thomson Reuters Eikon data shows “no U.S. coking coal was exported to China between late 2014 and 2016, but shipments soared to over 400,000 tonnes by late February.”

Is China having a change of heart on its relationship with North Korea? I don’t think as China’s trade with North Korea still increased by almost 40% in the first quarter of this year. China also buys other stuff, such as minerals and seafood. Looks like China wants to be on the good side of North Korea and Trump. The Art of the Deal.

Is this time is also different when it comes to the stock market? I don’t believe so. I’m not worried about the negative impact on the stock market due to North Korea, even though they were to be invaded.

However, I’m watching very cautiously China and Russia getting into an armed conflict with the U.S because of the North Korea situation. Armed conflict between the superpowers is a game changer. Although that’s very unlikely as superpowers argue all the time.

Suggestion For Your Portfolio

The situations might affect the markets for a very short period of time, especially if there’s uncertainty. But investors shouldn’t worry about it. The market could care less about a war, specifically when it’s aboard.

During the times of war, don’t reduce your holdings because of misconception war is bad. If you do, you will miss the gains.

Figure 6: Capital Market Performance During Times of War
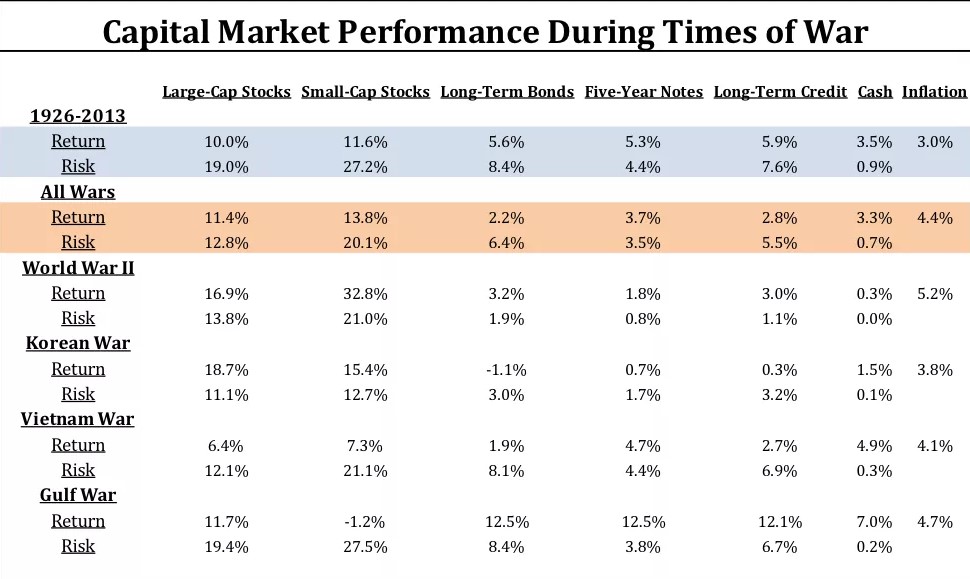
Sources: The indices used for each asset class are as follows: the S&P 500 Index for large-Cap stocks; CRSP Deciles 6-10 for small-cap stocks; long-term US government bonds for long-term bonds; five-year US Treasury notes for five-year notes; long-term US corporate bonds for long-term credit; one-month Treasury bills for cash; and the Consumer Price Index for inflation. All index returns are total returns for that index. Returns for a war-time period are calculated as the returns of the index four months before the war and during the entire war itself. Returns for “All Wars” are the annualized geometric return of the index over all “war-time periods.” Risk is the annualized standard deviation of the index over the given period. Past performance is not indicative of future results.

October Jobs Report Strong: It Is Just One Report

On November 6 (Friday), jobs report for October had the winds of 120 miles per hour and blew everyone away. Non-farm payrolls showed 271,000 jobs were added in October, the most gain since December and a huge beatdown on expectations of about 185,000. It’s the best month for job growth so far this year. The report follows two consecutive months (August and September) of weak jobs growth below 160,000.

The total job gains for August and September were revised 12,000 higher. August was revised 17K higher to 153K from 136k, and September was revised -5K lower to 137K from 142K. Over the last 12 months, employment growth had averaged 230K per month, vs. 222K in the same-period of 2014. In 2014, average monthly payrolls was 260K. This year, it is 206K. Not only jobs gains for October were strong, but also unemployment and wages.

Total Non-Farm Payrolls – Monthly Net Change

The unemployment rate dipped 0.1% to 5%, its lowest level since April 2008. Average hourly earnings rose by 9 cents an hour to $25.20. It rose 2.5% year-over-year (Y/Y), the best level since July 2009. For most of the “recovery”, wages has been flat. The increase in earnings is significant for two reasons. More money for employees means more spending (don’t forget debts), which accounts two-thirds of the economy. Second, wage growth might suggest that employers are having trouble finding new workers (should I say “skilled” workers) and they have to pay more to keep its workers and/or to get new skilled workers. This could draw more people back into the labor market, increasing the participation rate. Without the right skills, good luck.

Average Hourly Earnings and Average Weekly Hours

The labor force participation rate remained unchanged at a 38-year (1977) low of 62.4%. The long-term decline in the participation rate is due to the aging of the baby-boom generation and loss of confidence in the jobs market. There hasn’t even been a rebound in participation rate of prime-age Americans (between the ages of 25 and 54).

Unemployment Rate + Labor Force Participation Rate

More than 122 million Americans had full-time jobs at the end of October, the highest since December 2007 (121.6 million).

Full-Time and Part-Time Employment

Immediately after the jobs report, the probability of a rate-hike in December lifted. Fed funds futures currently anticipates about 65% chance of a rate hike next month vs. about 72% immediately after the report and about 55% before the report.

Federal Reserve Chairwoman, Janet Yellen, lately has been saying that December’s Federal Open Market Committee (FOMC) meeting was “live” for a potential rate-hike. While this jobs report is positive, I believe it is too early to jump in on conclusions.

The policymakers should not be too quick to act on one report. In September, the Fed left rates unchanged mainly due to a low inflation. Inflation is still low and we will get a fresh look on Tuesday (November 17) when Consumer Price Index (CPI) is released.

In March, the Fed expressed worries about the strength of the U.S. Dollar, just after the greenback hit above $100 mark. The greenback then tumbled and has never recovered back to $100….yet.

US Dollar ("/DX" on thinkorswim platform) - Daily
US Dollar (“/DX” on thinkorswim platform) – Daily

Right after the jobs report, the dollar skyrocketed and was 40 cents away from hitting $100 mark. It’s currently at $98.88 and there is a very high chance it will go above $100 until December 15, the first day of FOMC meeting.

If the November job numbers does not surprise to the upside (released in December 4), inflation stays low, and the dollar keeps strengthening, I do not believe the Fed will hit the “launch” button for a rate-hike liftoff.

Market Reactions:

US Dollar ("/DX" on thinkorswim platform) - Hourly
US Dollar (“/DX” on thinkorswim platform) – Hourly
S&P 500 Index ("SPX" on thinkorswim platform) - Hourly
S&P 500 Index (“SPX” on thinkorswim platform) – Hourly

Another Quantitative Easing In The United States?

Last Thursday (September 17), the Federal Reserve left rates unchanged due to low inflation, recent turmoil in financial markets and in economies abroad, particularly China.

Markets were pricing less than 30% chance of rate-hike and most people in the financial markets were not expecting rate-hike. Well, not me. I was actually expecting 0.25%, 10 basis points rate increase, as I stated in my previous post.

“Recent global economic and financial developments may restrain economic activity somewhat and are likely to put further downward pressure on inflation in the near term.” Federal Open Market Committee (FOMC) said in statement. They are referring to events that took place in August, that can be described in one word; uncertainty.

Before we go any further, let’s compare the last two Fed statements.

Statement Comparison in PDF

Federal Reserve "Dot Plot" - September 2015 Meeting
Federal Reserve “Dot Plot” – September 2015 Meeting


According to the Fed’s famous “Dot Plot” – that is where committee members think interest rates are going – one committee member, for the first time ever, thinks the U.S needs to move to negative interest rates until the end of 2016.


During the press conference, Janet Yellen – the chairwoman of the Fed – indicated that negative rates were not “seriously considered at all today” and that the policymaker in question was “concerned by the inflation outlook”. The Fed looks at a model “Phillips Curve” which states that inflation and unemployment have a stable and inverse relationship. It hasn’t been working lately.

We know, as of today, both employment and inflation is low, likely due to the fact that many people are not in labor force and they are not included in unemployment calculation and due to low energy prices.

She said something that I found very interesting, “That’s something we’ve seen in several European countries. It’s not something we talked about today. Look. If not– I don’t expect that we’re going to be in the path of providing additional accommodation but if the outlook were to change in a way that most of my colleagues and I do not expect and we found ourselves with a weak economy that needed additional stimulus, we would look at all of our available tools and that would be something that we would evaluate in that kind of context.” This shows that even the Fed is uncertain about the future and another quantitative easing is a possibility.

If you want to see the body language from Yellen as she said it, go watch the press conference video. It can be very interesting. Any body language experts here?

The Fed also raised growth forecast for the year and cut unemployment projection.

Federal Reserve Economic Projections - September 2015 Meeting
Federal Reserve Economic Projections – September 2015 Meeting

Yellen expressed that some countries other than China are also danger to the U.S, “…we saw a very substantial downward pressure on oil prices and commodity markets…significant impact on many emerging market economies that are important producers of commodities, as well as more advanced countries including Canada, which is an important trading partner of ours that has been negatively affected by declining commodity prices, declining energy prices….important emerging markets have been negatively affected by those developments. And we’ve seen significant outflows of capital from those countries, pressures on their exchange rates and concerns about their performance going forward. So, a lot of our focus has been on risks around China but not just China, emerging markets, more generally in how they may spill over to the United States.”

Back to “wait and see” mode again. Weak start in the year hammered the chances of rate-hike in June. Now, outsiders hammered the chances of rate-hike in September. Next stop?

If the current situation stays unchanged, I expect rate increase of 0.10% (again) in October (FOMC press conference will be called if the Fed decides to change rates). But, the current situation might get much worse. The bad news might come from China again.

Xi Jinping, China’s president and Communist Party chief, will arrive in the U.S next week to meet President Obama and business leaders. After the meeting when Mr. Xi is back in China, unpredictability arrives.

China would not want to create tension with the U.S before they meet face-to-face. Thus, unpredictability comes in two or three weeks. China might devalue their currency again, by 5% or more. They might even dump much more U.S Treasuries again.

It’s reported that China dumped U.S Treasurys of $83 billion and $94 billion in the month of July and August, respectively. Why would China sell U.S Treasurys? China is in dire need of cash. Capital outflows are increasing substantially and their stock market are declining substantially. China would want to cut its holdings of treasurys to support the yuan.

According to latest data from the U.S Treasury Department, China’s holdings of U.S Treasuries was $1.240 trillion in the end of July (is probably much less now), the smallest since February 2015. In end-June, China held $1.271 trillion. China remains the world’s largest holder of U.S debt. What does that mean for the U.S?

If U.S’s #1 lender stops supporting or stops buying U.S debt, the cost of everything that depends on Treasury rates could rise, putting pressure on the Federal Reserve and prevent the Fed from raising rates. Treasury yields (inverse relationship with prices) are the benchmark that sets the cost of borrowing.

China’s abandonment of U.S Treasury debt is a warning.

Imagine if China’s major trading partner, Japan, joins China in selling U.S Treasuries. Japan is the second-largest holder of U.S. Treasuries, with $1.197 trillion in July. The devaluation of Yuan will make Japanese exports less competitive. Japan’s economy is still suffering despite Abenomics. As I stated in my post “Global Markets Crash + Asian Crisis Part 2“, Abenomics has failed. Soon enough, Japan might also be in dire need of cash and they might start cutting their holdings of U.S Treasuries.

Recently, Standard & Poor’s slashed its ratings on Japanese debt from AA- to A+ because of weak economic growth, blaming Abenomics “…we believe that the government’s economic revival strategy–dubbed “Abenomics”–will not be able to reverse this deterioration in the next two to three years.” According to Standard & Poor, Japan’s Debt/GDP ratio currently stands at 242.4%, a dangerous level for developed country.

I believe Bank of Japan (BoJ) will increase its purchases of government debt to cover the danger of Japan’s Debt/GDP ratio and will sell portion of U.S Treasurys.

We can conclude everything will probably get much worse. The Fed will have no other choice, but to start another round of quantitative easing. In other words, debt monetization, a process of buying Treasury and corporate debt on the open market, increasing money supply. When increasing money supply, interest rates should fall.

The Fed is being held hostage by outsiders, such as China and Brazil. It probably won’t end well for the U.S, promoting another round of Quantitative Easing.

Markets’ reactions to the Fed report:

S&P 500 (“SPX”) – Hourly Chart
US Dollar (“/DX”) – Hourly Chart
Gold ("/GC") - Hourly Chart
Gold (“/GC”) – Hourly Chart
EUR/USD - Hourly Chart
EUR/USD – Hourly Chart