Cisco’s Impressive 4th Quarter Earnings Report

This is a follow up post to the previous post (Cisco Systems Inc. (NASDAQ: CSCO) Undervalued). Before continuing to read this post, I suggest reading the previous post if you haven’t already. The previous post includes some important facts that are not included in this post. If you have any questions/comments, feel free to leave a comment below or contact me. Thank you.


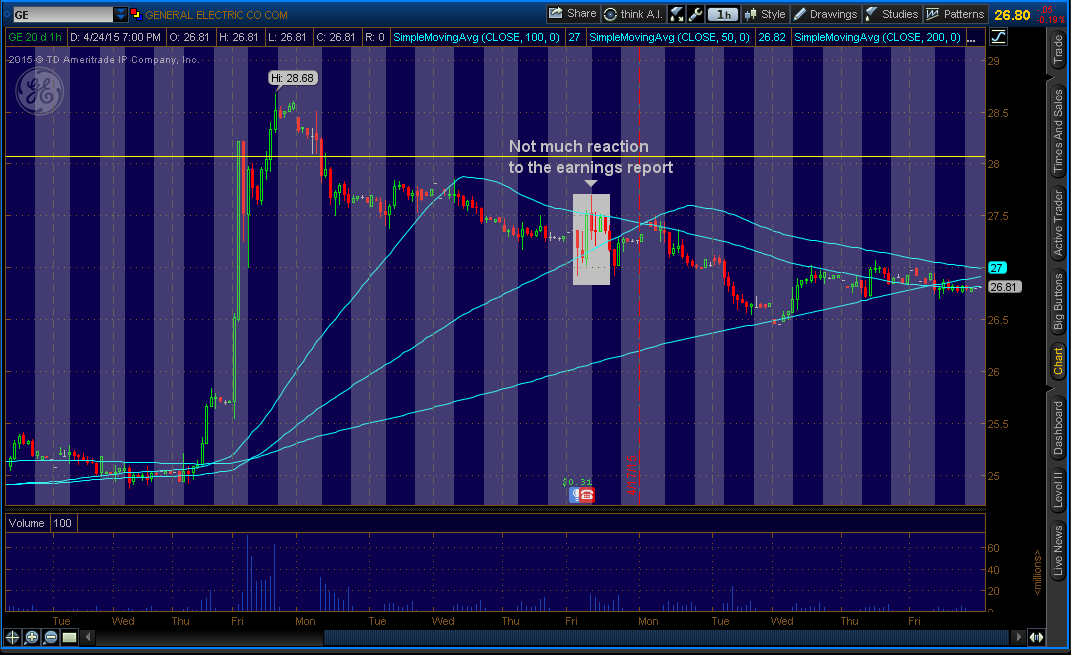
On Wednesday (August 12, 2015), Cisco (NASDAQ: CSCO) reported its first earnings report with Chuck Robbins (CEO of Cisco) at the helm and it was very impressive. For 4th Quarter Fiscal Year 2015 (Q4 FY’15), revenue was $12.8 billion, up 3.9% year-over-year (Y/Y) from $12.4 billion and EPS (GAAP) was $0.45 per share, up 4.7% Y/Y from $0.43. Net income (GAAP) was $2.3 billion, up 3.2% Y/Y from $2.2 billion.

This earnings report concludes Fiscal Year (FY) 2015. Let’s take a look at FY GAAP results. FY’15 revenue grew 4.3% year-over-year to $49.2 billion from $47.1 billion. Net income grew 14.4% to $9 billion from $7.9 billion and EPS grew 17.4% to $1.75 from $1.49.

During FY’15, Cisco continued its commitment to shareholder return – returning $8.3 billion through share buybacks and dividends – 73% of free cash flow. Yet, Cisco has total cash, cash equivalents, and investments of $60.4 billion, up 16.02% Y/Y from $52 billion in Q4 FY’14.

Key Financial Measures
Key Financial Measures – Cash, Debt, OCF

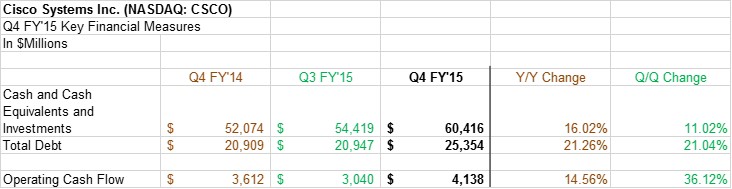
The company has $25.4 billion in debt, 21.26% increase Y/Y. Their operating cash flow increased 14.56% Y/Y to $4.1 billion. I don’t see the current debt as a problem since the company has a strong balance sheet.

Regional Performance:

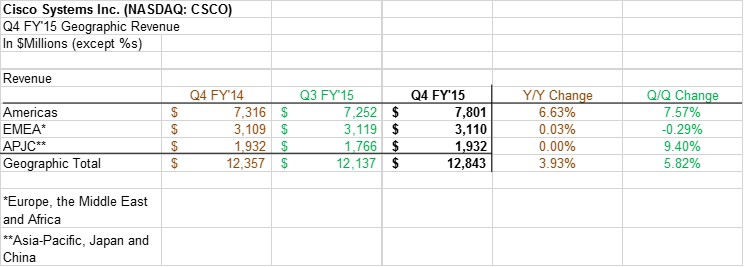
Americas revenue increased 6.63% Y/Y to $7.8 billion. EMEA (Europe, the Middle East and Africa) was slightly flat at $3.1 billion. APJC (Asia-Pacific, Japan and China) was flat at $1.9 -billion. Both EMEA and APJC revenue was affected by forex (currency) headwinds. With strengthening dollar – which hurts sales revenue aboard – Cisco should be able to offset the headwinds from it because of a strong domestic market. Stronger dollar makes American goods expensive and less competitive overseas, hurting earnings for U.S. companies. Cisco has a very strong domestic market and continues to increase its footsteps.

Geographic Revenue
Geographic Revenue

Guidance: (Not a big fan of guidance)

Cisco expects 2%-4% Y/Y revenue growth and EPS of $0.55-$0.57 for Q1 FY’16, in-line with a consensus for 2.5% growth and EPS of $0.56. While company’s guidance is important, I believe your own guidance for the company is more important.

Segment Performance:

Cisco Segment Performance - Q4 F'15
Cisco Segment Performance – Q4 F’15 – Source: Slide 7

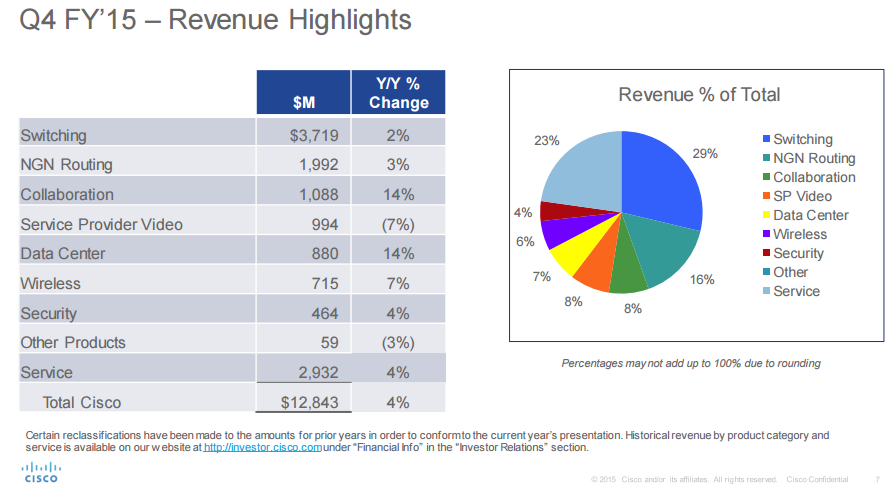
Product revenue grew 4% Y/Y. Out of nine segments, two segments (“Service Provider Video” and “Other Products”) declined Y/Y, but remaining seven segments grew.

Today, Cisco is looking to acquire businesses focusing on wireless software, video delivery, cloud-based security technologies and investments in cyber-security. They are more likely to acquire smaller companies with strong presence in areas (product and geography) that Cisco itself does not have. The company plans to invest $1 billion into the United Kingdom over the next 3-5 years to boost the country’s technology sector, especially Internet of Things (IoT). During the Q4 FY’15 Conference call, Kelly Kramer, Chief Financial Officer (CFO) stated that Cisco was “…committed to looking at the right acquisitions at the right price to drive our growth strategy.” I’m currently looking into companies that I believe Cisco should acquire (post to come regarding it, if I find a suitable company).

Key Financials:

Key Financials (Q4 FY'10 - Q4 FY'15)
Key Financials (Q4 FY’10 – Q4 FY’15)

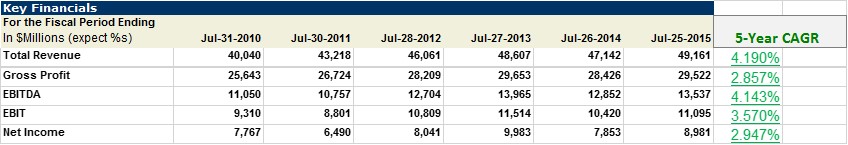
In the “Key Financials” chart above, you see “EBITDA” and “EBIT”. Let me take a moment to explain what they are and why they are important.

EBITDA: An acronym for “Earnings Before Interest, Taxes, and DD&A (Depreciation, Depletion and Amortization)”. It’s an income statement metric which represents earnings prior to the payment of interest expense, taxes, depreciation, depletion and amortization. EBITDA is a proxy for (but not a substitute for) cash flow generated by the assets of a company (In this case, Cisco) before debt holders and tax authorities are paid. A good EBITDA growth rate can show investors that the company has a future for potential growth.

EBIT: An acronym for “Earnings Before Interest and Taxes”. EBIT is similar to EBITDA, but It’s an income statement metric which represents earnings prior to the payment of interest expense and taxes.


5-Year CAGR (Compounded Annual Growth Rate):

  • Total Revenue: 4.19%
  • Gross Profit: 2.86%
  • EBITDA: 4.14%
  • EBIT: 3.57%
  • Net Income: 2.95%

While 5-Year CAGR numbers may look small, it’s very reasonable for a company of Cisco’s size.

I love the valuation at current levels. My target price is $32, unchanged from previous post. I’m taking “Warren Buffett” style approach on Cisco. I’m in this for a longer-term and my target price will change as time goes on. Strategic acquisitions, for example, will increase my target price because in the longer-term, the acquired company (depending on the company) will bring in more income although there will be costs in a short-term. After all, it’s the opportunity cost.

Any pullbacks in the stock price will be taken as an opportunity to buy more shares. The only con are the brokerage fees that comes as a disadvantage to small investors like myself.

If you have been wondering why non-GAAP numbers are not listed here, it’s because I don’t look at them much. Companies can do whatever they want to do with it and it’s hard to trust the non-GAAP numbers. On Cisco’s financial reports, they state “These non-GAAP measures are not in accordance with, or an alternative for, measures prepared in accordance with generally accepted accounting principles and may be different from non-GAAP measures used by other companies.”

Non-GAAP is a propaganda tool to raise capital and/or stock price (AKA equity compensation).

I’m not saying I don’t look at non-GAAP numbers, but GAAP is much more important to look at. Exceptions to look at non-GAAP are when there are such reasonable large write-downs and/or restructuring charges (one-time, non-recurring” expenses). Reasonable.

All comments welcomed.


Disclosure: I’m currently long on the stock, CSCO. I went long last year at price just below $25. I will continue to be long.

Note: All information I used here such as revenue, income, etc are found from Cisco’s official investor relations site, Bloomberg terminal, FactSet, and S&P Capital IQ. The pictures you see here are my own (except “Cisco Segment Performance – Q4 F’15”).

Disclaimer: The posts are not a recommendation to buy or sell any stocks, currencies, etc mentioned. They are solely my personal opinions. Every investor/trader must do his/her own due diligence before making any investment/trading decision.

GE’s slight positive earnings report and it’s about to change

Previous post about GE: https://www.outofwacc.com/ges-massive-makeover/

UPDATE:

On April 17, 2015, General Electric (NYSE:GE) reported Q1 2015 earnings results. GE reported $34.09 billion and $5.08 billion in segment revenue and profit, respectively, compared to Q1 2014 results of $35.06 billion and $5.21 billion in segment revenue and profit, respectively. In earnings per share (EPS) terms, GE reported EPS of $0.31 per share, which compares against $0.33 per share in the same quarter last year, down 6% year-over-year, but still managed to beat the consensus estimate of $0.30 per share.

Their earnings were impacted by Forex market and significant charges related to GE Capital exit activities. During the Q1 2015 conference call,  Mr. Jeffrey Bornstein, Senior Vice President (SVP) and Chief Financial Officer (CFO) for GE, highlighted a common issue felt by many international companies: “Foreign exchange was approximately $940 million drag on Industrial segment revenue and about $120 million impact on op profit.” Almost $1 billion currency market impact only effected 4% of industrial revenue. However, the management stated “Despite this headwind, industrial segment operating profit was up 9%.


GE Industrial Segment Revenue year-over-year


As seen above, the picture shows Industrial Segment revenue year-over-year. There was not much of change. I believe it’s going to change since GE is taking a bold move.

Even though GE faced many headwinds, including from foreign exchange and low oil prices, they still managed to grow. Strong dollar and low energy prices are only temporary. It’s just a matter of time before the dollar depreciates and oil prices rebound. I have no doubt that GE will continue to succeed.

GE recorded a health margin improvement in the 1st quarter. Industrial segment gross margin increased 90 basis points (bps), or 0.9% to 26.2%, while operating profit margins increased by 120 bps, or 1.2% to 14.6%. The company is cutting costs and simplifying operations to lift margins, which is a positive sign.

Recently, GE announced to reduce the size of its financial arm, GE Capital, significantly. Last quarter, revenue from GE Capital fell 39%. This is because GE have already started reducing the size of GE Capital to become an industrially focused company, which I look it as positive in the longer term. A negative side of GE Capital reduction are taxes. GE will be losing out on significant tax breaks. GE Capital has helped GE lower its effective tax rate in the past. In 2014, GE’s effective tax rate was around 10%. Now, it moved up to about 23%. While this is a big difference, it should not be concern for investors, because it is in line with other industrial companies. Financial companies are the most vulnerable to shocks of the global financial markets. Thus, GE is taking the right move to spin off its financial unit. In a long-term, I believe more focused industrial company is positive for GE.

GE is known for its dividends. GE pays shareholders $0.92 annual dividend, or 3.43% yield, which is really impressive.

GE expects double-digit Industrial operating EPS growth to $1.20-$1.20 per share, 2%-5% industrial segment organic revenue growth, and increased margins. The company also expects high-value industrial to comprise more than 90% of GE earnings by 2018.

To conclude, I plan to hold my position (more details on previous post: https://www.outofwacc.com/ges-massive-makeover/). I will be adding more shares through dividend reinvestment, or Dividend Reinvestment Plan (DRIP) program. I also might buy additional shares. I strongly believe GE’s restructuring plan will lead to significant capital appreciation and I have no doubt GE will increase its dividend distribution.


General Electric (NYSE: GE) Hourly Chart


Feel free to comment below. If you need to contact me, click “Contact Me” above and send your message. Thank you.

Ugly Jobs Report Is Just Temporary

Last Friday (April 3, 2015), March non-farm payrolls came out very negative. Non-farm payrolls slowed in March to a seasonally adjusted 126,000, slowest since December 2013. Unemployment rate held unchanged at 5.5%. The downturn in the jobs report could delay the Federal Reserve’s plan on raising the interest rates. Federal Open Market Committee (FOMC) have said in the past that continued improvement in labor would be a key factor on the timing of the rate-hike. I, now, believe there is a little chance of rate-hike in June.

What caused the downturn in the labor market? I believe it was because of the bad weather, plunging oil prices, and the strong dollar. The bad weather have caused businesses, especially in construction, to lose profits and to halt hiring. However, weather is a transitory factor. Plunging oil prices have left the oil industry in the dust. Oil companies are not being able to make revenue/profit. As a result, they had to layoff some of their employees. Strong Dollar is putting pressure on export-driven manufacturers, resulting in lower sales leading to layoffs. It’s also making it harder for U.S. businesses to sell goods aboard. I believe majority of U.S businesses’ revenue or earning per share (EPS) will less than expected, for the quarter.

Not only did we get to see March jobs report, but there were revisions to February and January jobs reports. January job creation was revised lower to 201,000 from 239,000 (-38,000). February job creation was revised lower to 264,000 from 295,000 (-31,000). I believe March jobs report will also be revised.

The labor-force participation rate was at 67.8%, lowest since February 1978. It shows that there’s less confidence in jobs market. Therefore, people have stopped looking for jobs. Average hourly earnings rose 7 cents or 0.3% to $24.86. The earnings can be a indicator for inflation. If it increases, inflation is more likely to increase too. Walmart and McDonald are increasing wages for majority of its employees, if not all of them.

Reactions to the report:

U.S Dollar (foreign exchange, or Forex) reacted negatively. U.S Equity markets were closed for Good Friday. We will get to see the reaction of equity market in the morning (Monday, April 7, 2015). I believe it will rise since negative jobs report could delay the rate-hike, since low interest-rate environment can very attractive to investors, including me.


If you have any questions, feel free to contact me anytime and/or leave comments. Thank you.