

Last Friday (May 8, 2015), non-farm payrolls report was released and it was in-line with expectations. 223,000 new jobs were added in April, and the unemployment rate fell by 0.1% to 5.4%, the lowest level since May 2008. While, this is a good news. March gains was revised down to 85,000 from the prior estimate of 126,000 (-41,000), lowest since 2012. I believe the April number (223,000) will also be revised lower.
Wage growth remained modest. Over the past 12 months, average hourly earnings have increased by 2.2%. As unemployment rate falls, wages should start to pick up speed, which also will push up inflation.
Fed officials are closely watching the labor market and other key economic reports, as they are in a tough spot on raising short-term rates, which have been held near zero since December 2008.
There is a very little chance of rate hike in June. I believe the Fed won’t hike the interest rates, unless over 350,000 jobs are added in May and unemployment rate goes down by 0.2% to 5.2% (which certainly will not happen).
First quarter was very weak due to; strong U.S. dollar, low energy prices, West Coast port strike, and the bad weather. When these four are combined together, it creates a heavy roof to push down economic growth.
Hiring has been strong in many industries, except energy. About 15,000 energy jobs were lost in April, worst month since May 2009. Lower oil prices increased the pressure on the energy sector. Low energy prices has caused energy companies to lose profits. As a result, they had to cut jobs. Recently, crude oil inventories supply were declining, which caused oil prices to rise above $60.
Last Tuesday (May 5, 2015), trade balance report was released and it exploded. The US trade deficit widened by 43.1% to a seasonally adjusted $51.4 billion in March, largest monthly expansion in the trade gap since December 1996 and the largest deficit reading since October 2008. Trade balance is when you subtract imports from exports. In other words, it’s the difference between imports and exports.
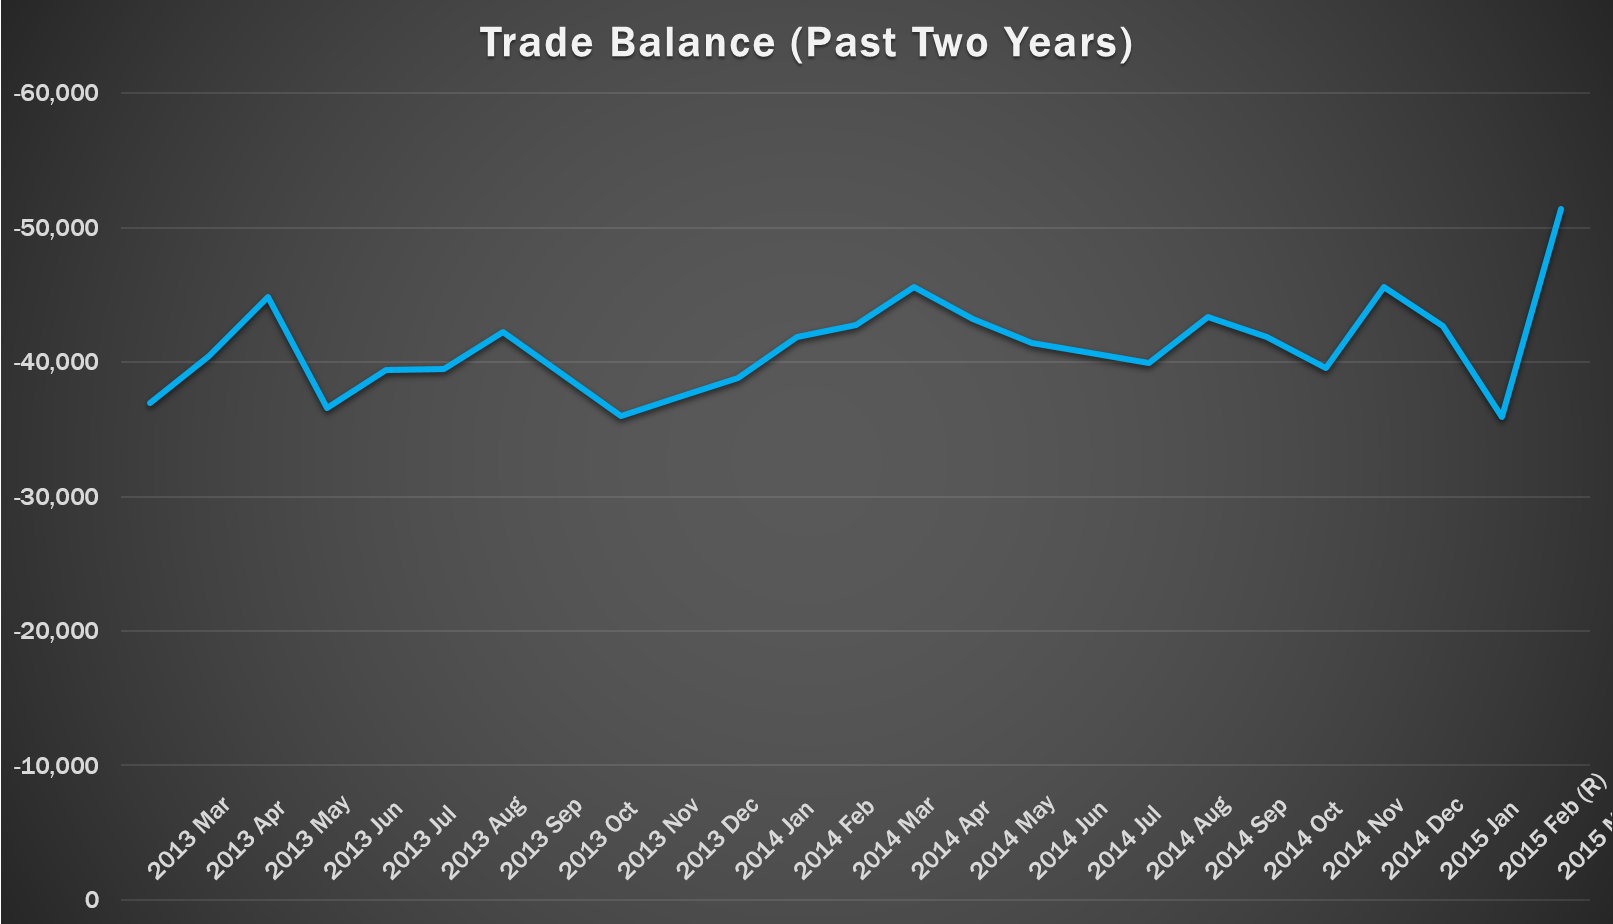
A biggest reason for the weakness was the 9-month slowdown at West Coast port due to a labor contract dispute. West Coast ports is back in business. Imports arriving though the West Coast port surged. Imports increased 7.7% in March, the largest increase on record. While exports only increased 0.9% in March, reflecting strong dollar impact. In the past 12 months, the dollar has jumped almost 10%. Strong dollar had made Americans goods and services less competitive in global markets. Bigger imports and smaller exports mean a bigger deficit.
I believe it’s not to worry about in a long term. Once the backlog is cleared, imports will drop and the trade deficit will also drop.
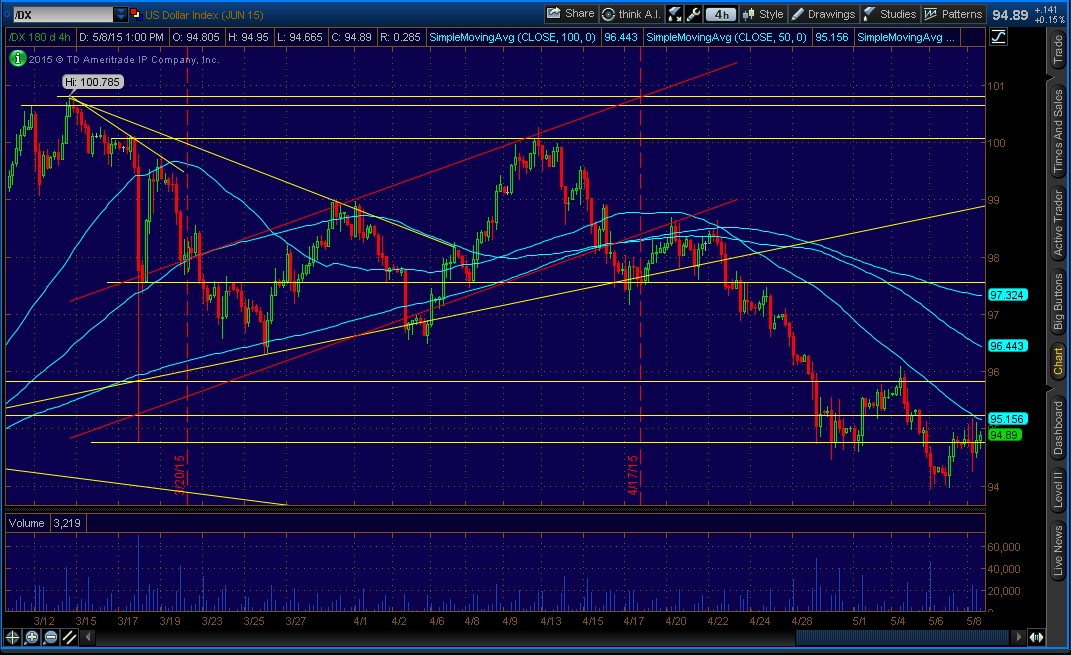
Recently, the dollar has fallen sharply because of weak US economic reports, including Gross Domestic Product (GDP).
On April 29, 2015 (Wednesday), GDP Advance estimate increased at an annual rate of 0.2% in the first quarter of 2015, down from 2.2% in the fourth quarter of 2014 (-2.0%). This is a huge difference. Economists were anticipating growth of 1% in the first quarter.
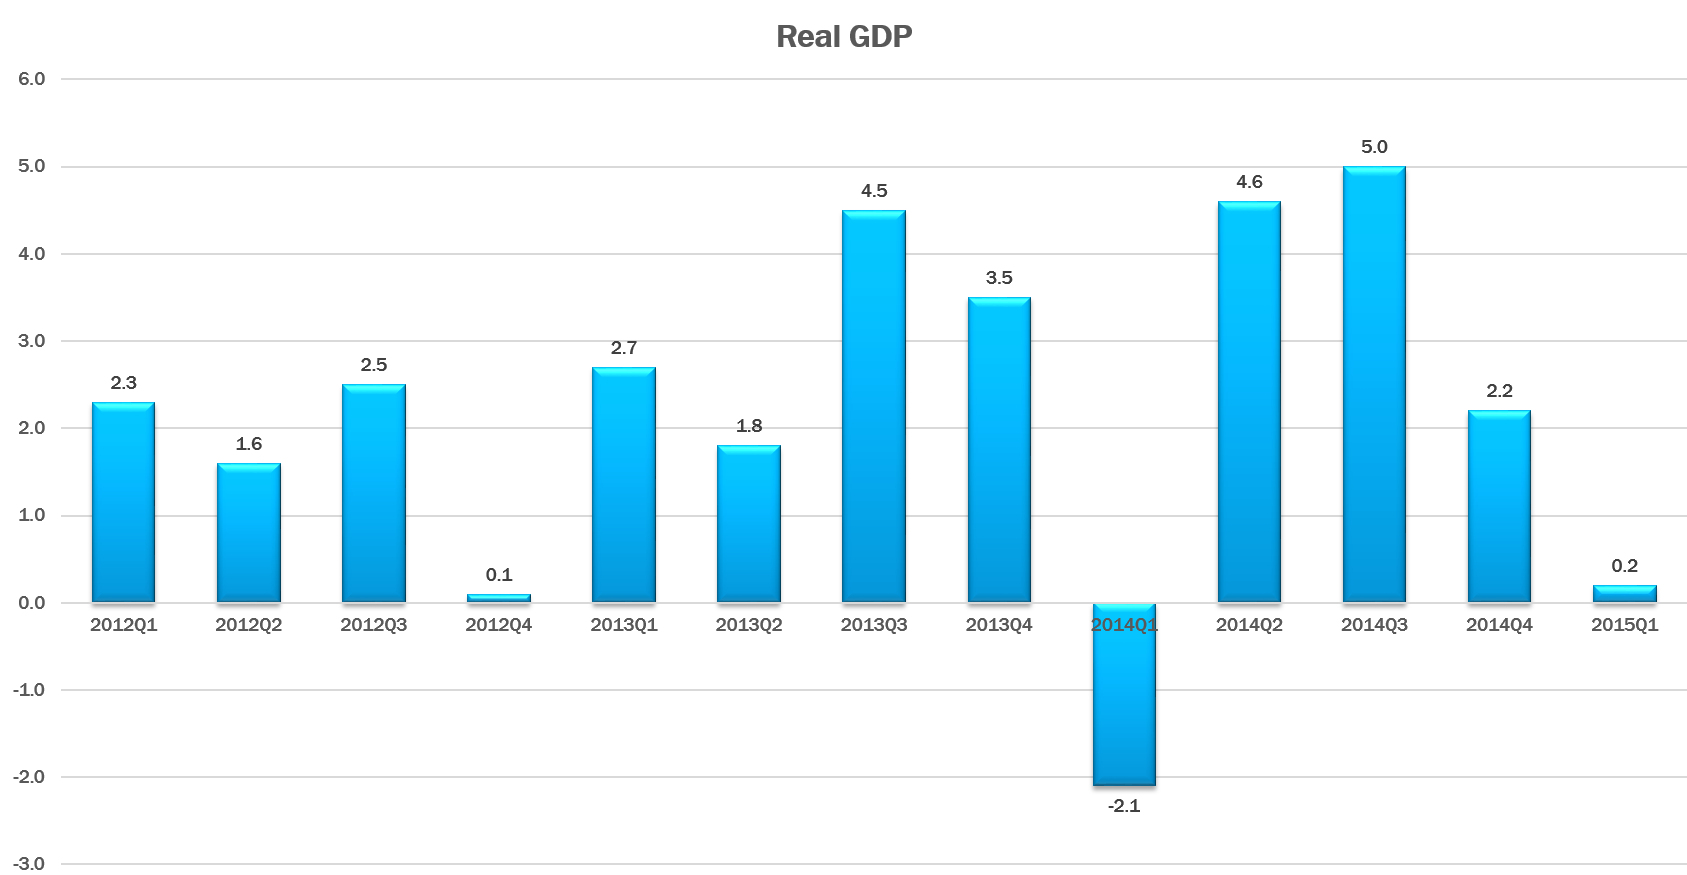
Again, the weakness was due to U.S. dollar, low energy prices, West Coast port strike, and the bad weather. West Coast port strike disrupted the flow of trade, increasing imports which negatively impact GDP. In the past 12 months, the dollar has jumped almost 10%.
According to the report, Real exports of goods and services decreased 7.2% in the first quarter, from an increase of 4.5% in the fourth quarter. Real Imports of goods and services increased 1.8%, from an increase of 10.4% in the fourth quarter.
I’m afraid that Q1 GDP will be revised to negative number. Second estimate (Preliminary) of Q1 GDP will be released on Friday, May 29, 2015.
First quarter GDP was disappointing. I believe the economy should bounce back in the 3 quarters of 2015.
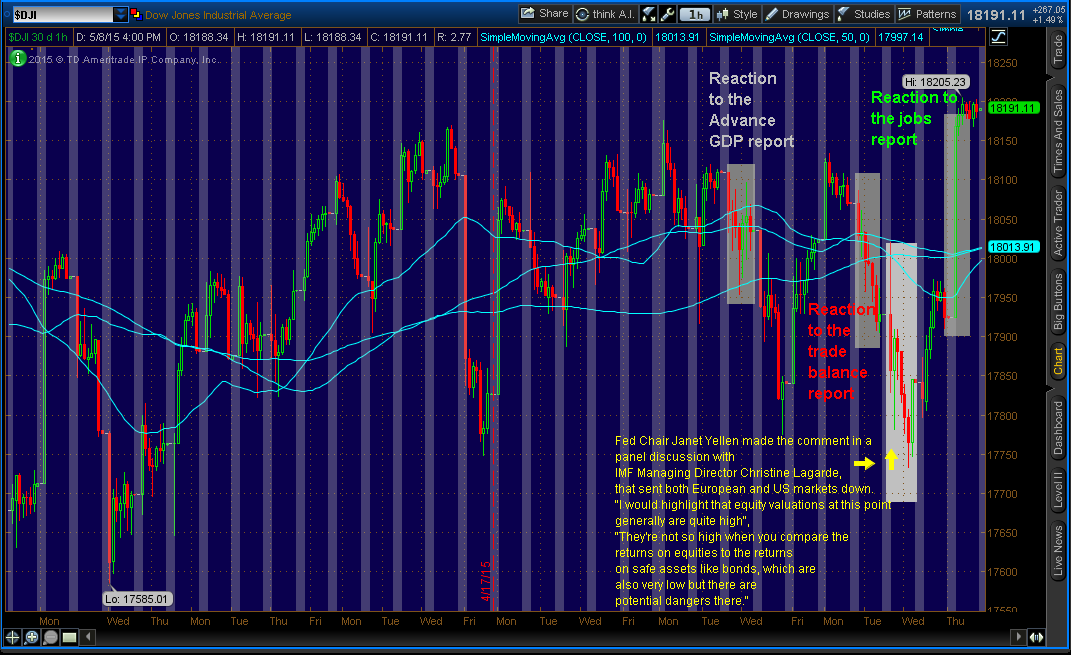
US markets were very happy with the jobs report, but not with other economic reports. The Dow soared more than 250 points, or 1.5% on Friday. While USD bracket currencies were mixed.
Check out the charts below; Dow Jones and US Dollar. US Dollar has fallen signification after hitting of $100.27 on mid-April. Dow Jones has been in a range. Dow Jones chart includes something “extra”, that’s not included in the post here.
If you have any questions, feel free to contact me anytime by going to “Contact Me” and/or leave comments below. Thank you.