October Jobs Report Strong: It Is Just One Report

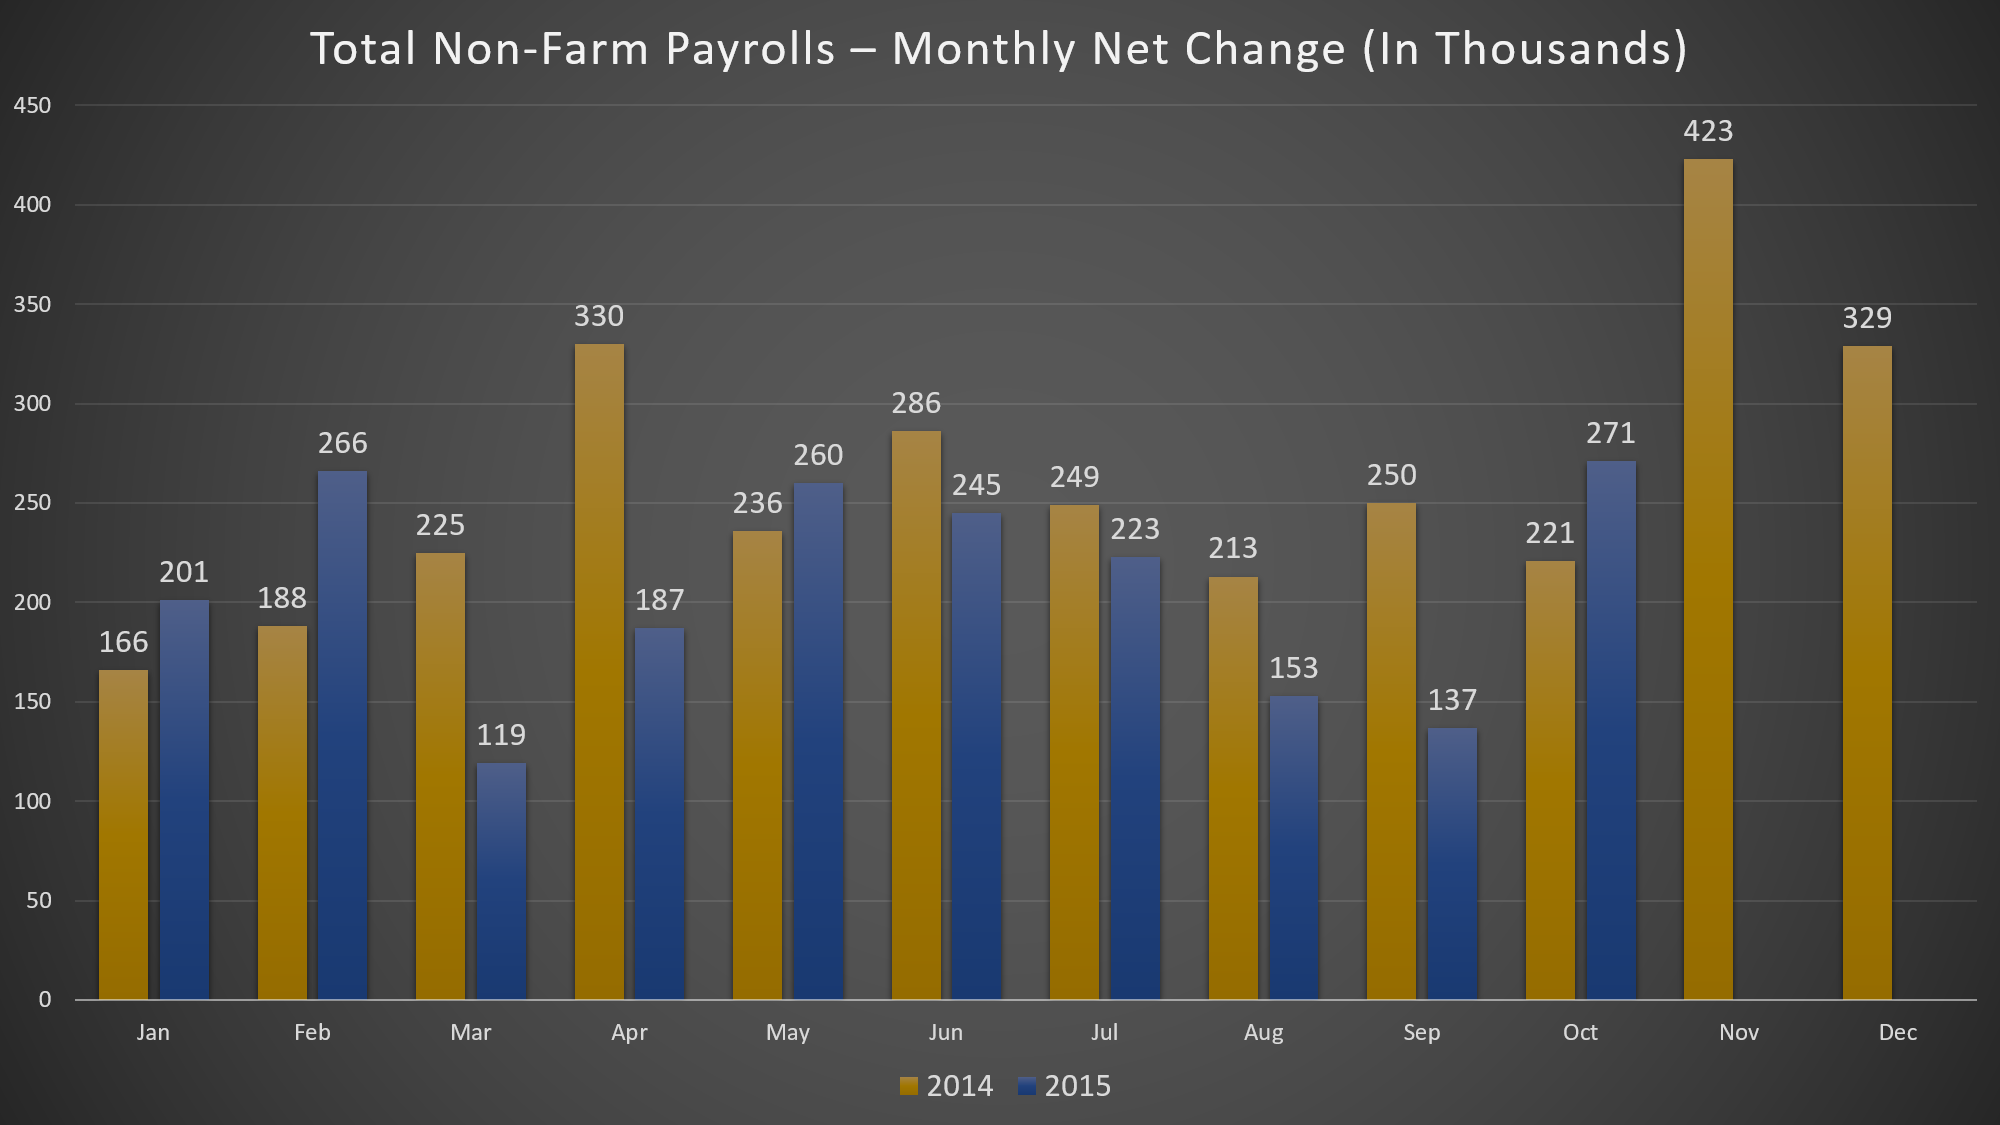
On November 6 (Friday), jobs report for October had the winds of 120 miles per hour and blew everyone away. Non-farm payrolls showed 271,000 jobs were added in October, the most gain since December and a huge beatdown on expectations of about 185,000. It’s the best month for job growth so far this year. The report follows two consecutive months (August and September) of weak jobs growth below 160,000.

The total job gains for August and September were revised 12,000 higher. August was revised 17K higher to 153K from 136k, and September was revised -5K lower to 137K from 142K. Over the last 12 months, employment growth had averaged 230K per month, vs. 222K in the same-period of 2014. In 2014, average monthly payrolls was 260K. This year, it is 206K. Not only jobs gains for October were strong, but also unemployment and wages.

Total Non-Farm Payrolls – Monthly Net Change

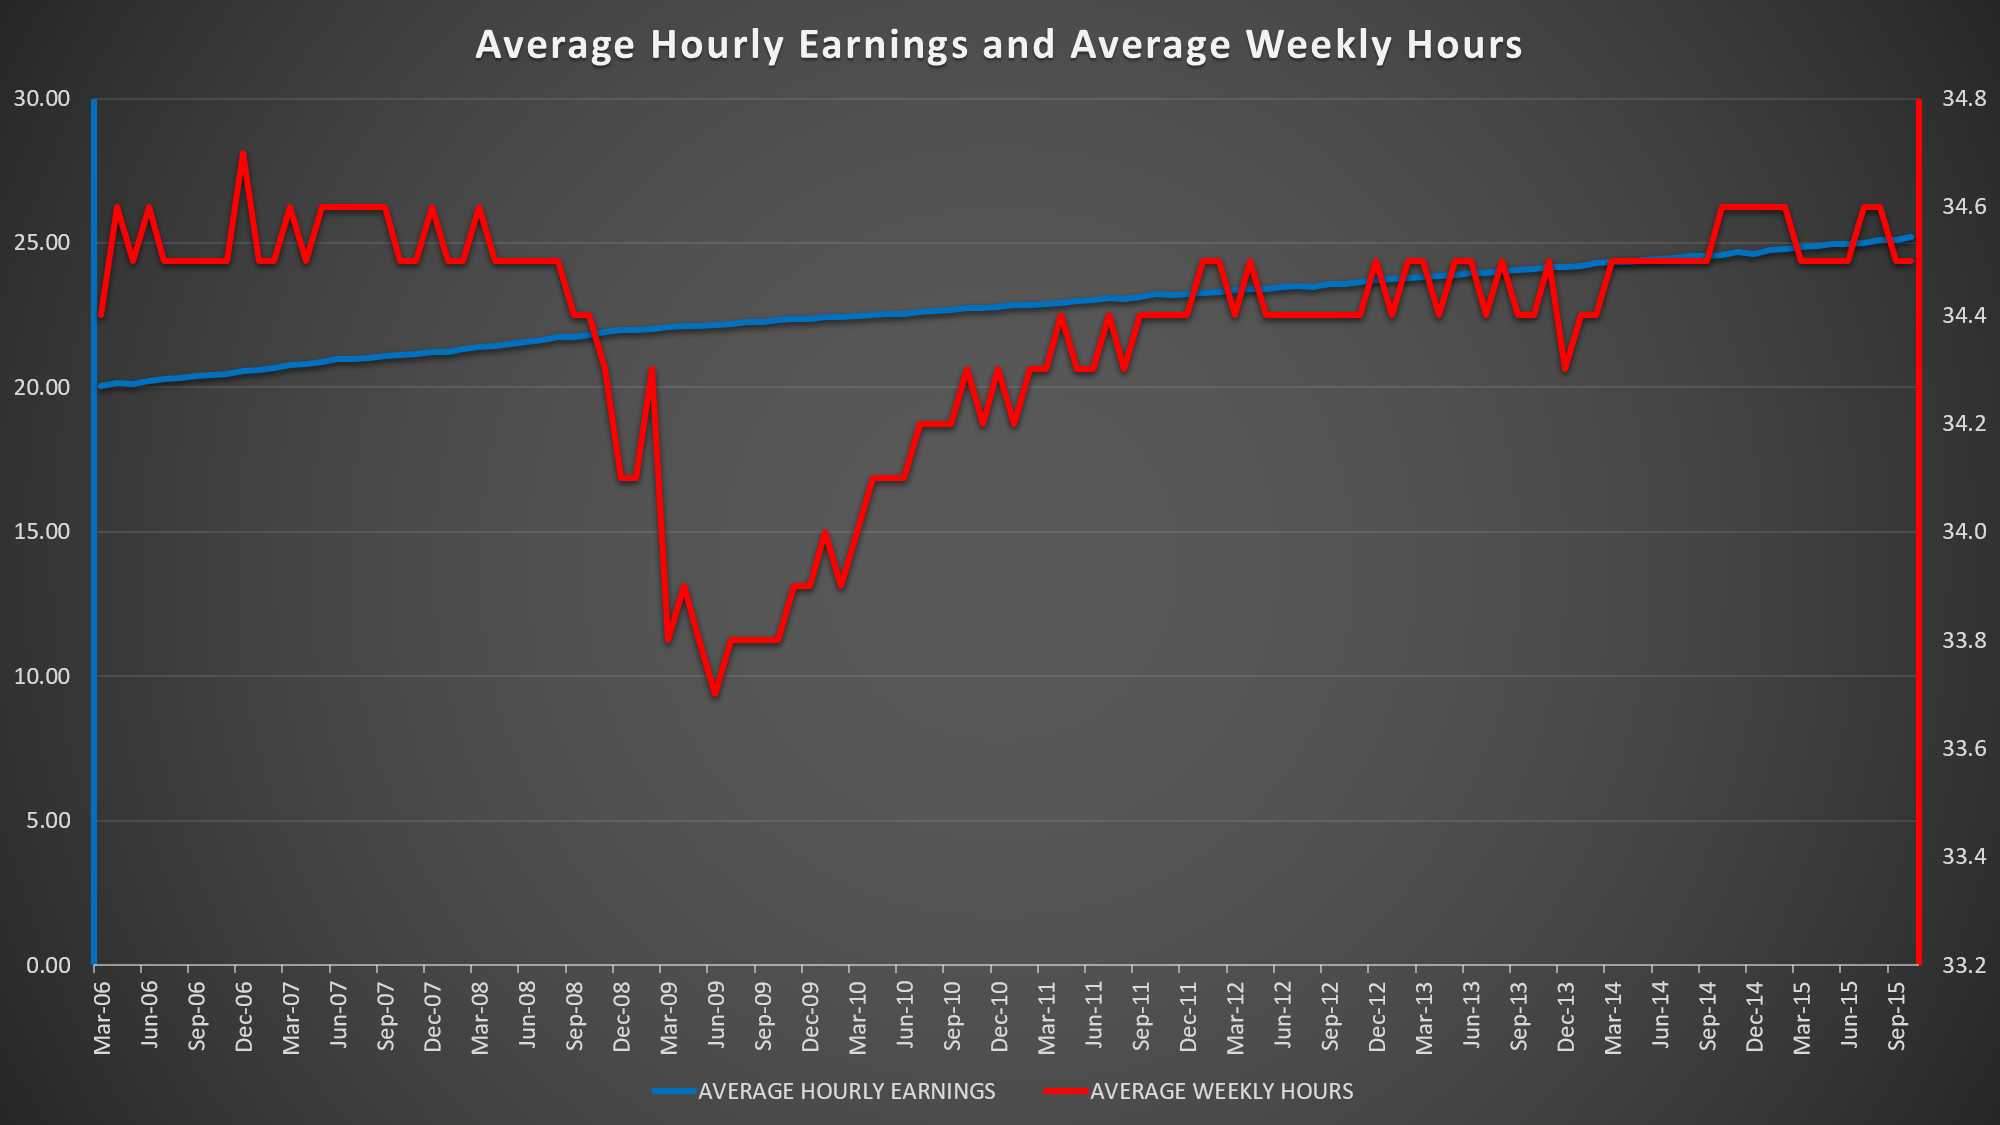
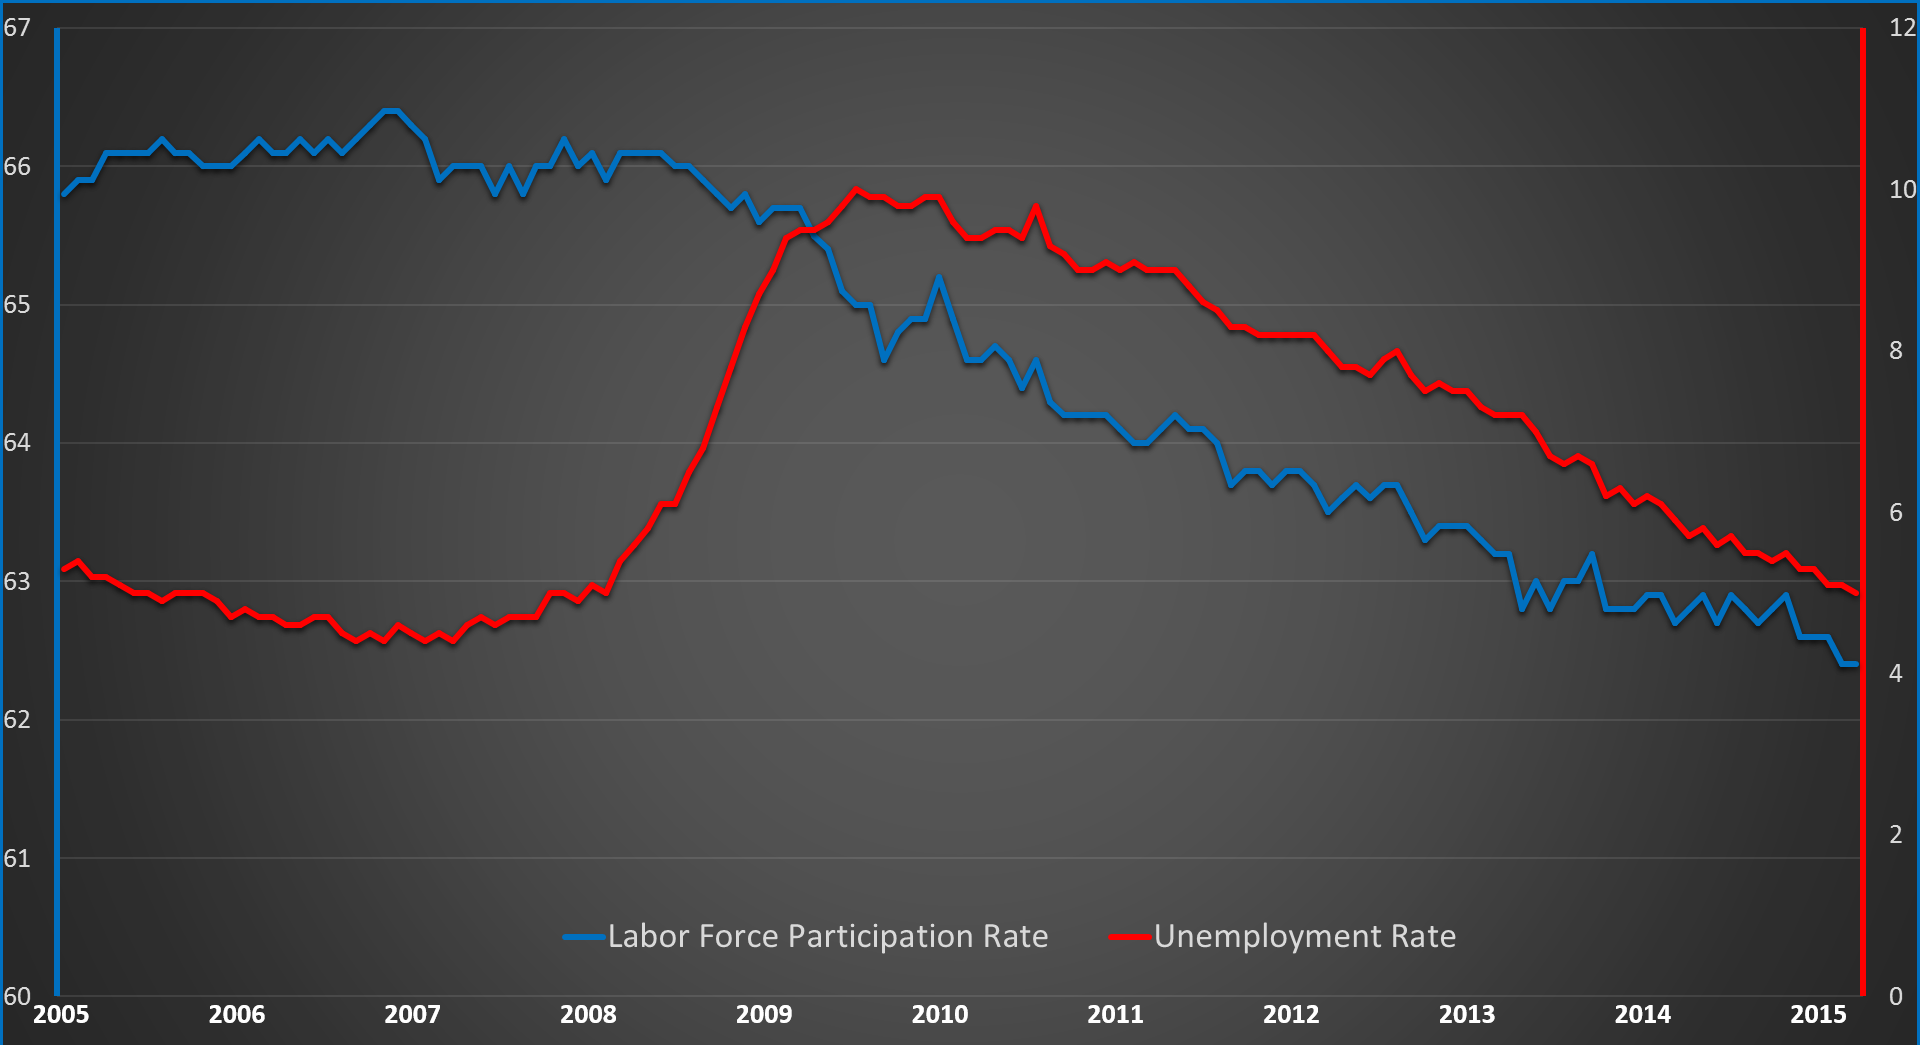
The unemployment rate dipped 0.1% to 5%, its lowest level since April 2008. Average hourly earnings rose by 9 cents an hour to $25.20. It rose 2.5% year-over-year (Y/Y), the best level since July 2009. For most of the “recovery”, wages has been flat. The increase in earnings is significant for two reasons. More money for employees means more spending (don’t forget debts), which accounts two-thirds of the economy. Second, wage growth might suggest that employers are having trouble finding new workers (should I say “skilled” workers) and they have to pay more to keep its workers and/or to get new skilled workers. This could draw more people back into the labor market, increasing the participation rate. Without the right skills, good luck.

Average Hourly Earnings and Average Weekly Hours

The labor force participation rate remained unchanged at a 38-year (1977) low of 62.4%. The long-term decline in the participation rate is due to the aging of the baby-boom generation and loss of confidence in the jobs market. There hasn’t even been a rebound in participation rate of prime-age Americans (between the ages of 25 and 54).

Unemployment Rate + Labor Force Participation Rate

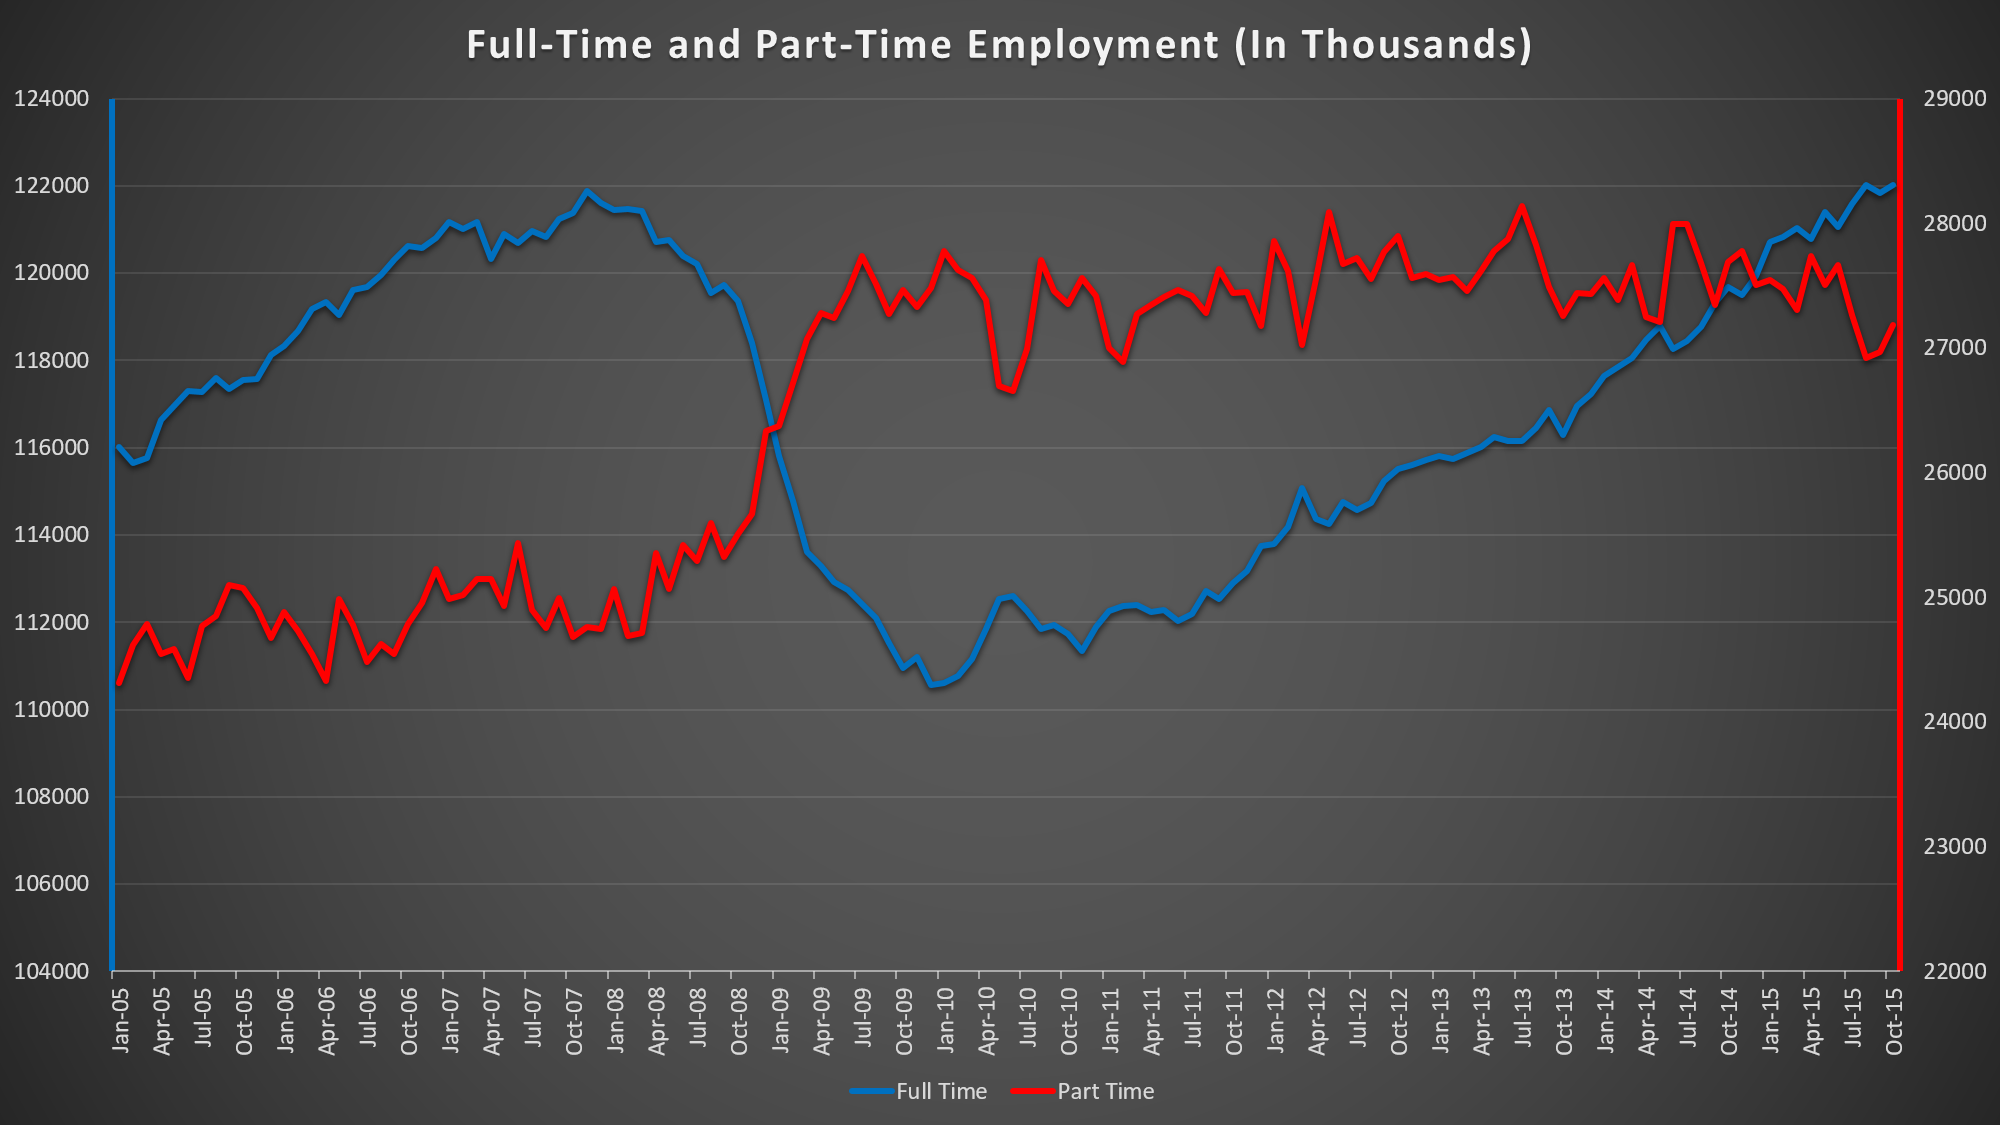
More than 122 million Americans had full-time jobs at the end of October, the highest since December 2007 (121.6 million).

Full-Time and Part-Time Employment

Immediately after the jobs report, the probability of a rate-hike in December lifted. Fed funds futures currently anticipates about 65% chance of a rate hike next month vs. about 72% immediately after the report and about 55% before the report.

Federal Reserve Chairwoman, Janet Yellen, lately has been saying that December’s Federal Open Market Committee (FOMC) meeting was “live” for a potential rate-hike. While this jobs report is positive, I believe it is too early to jump in on conclusions.

The policymakers should not be too quick to act on one report. In September, the Fed left rates unchanged mainly due to a low inflation. Inflation is still low and we will get a fresh look on Tuesday (November 17) when Consumer Price Index (CPI) is released.

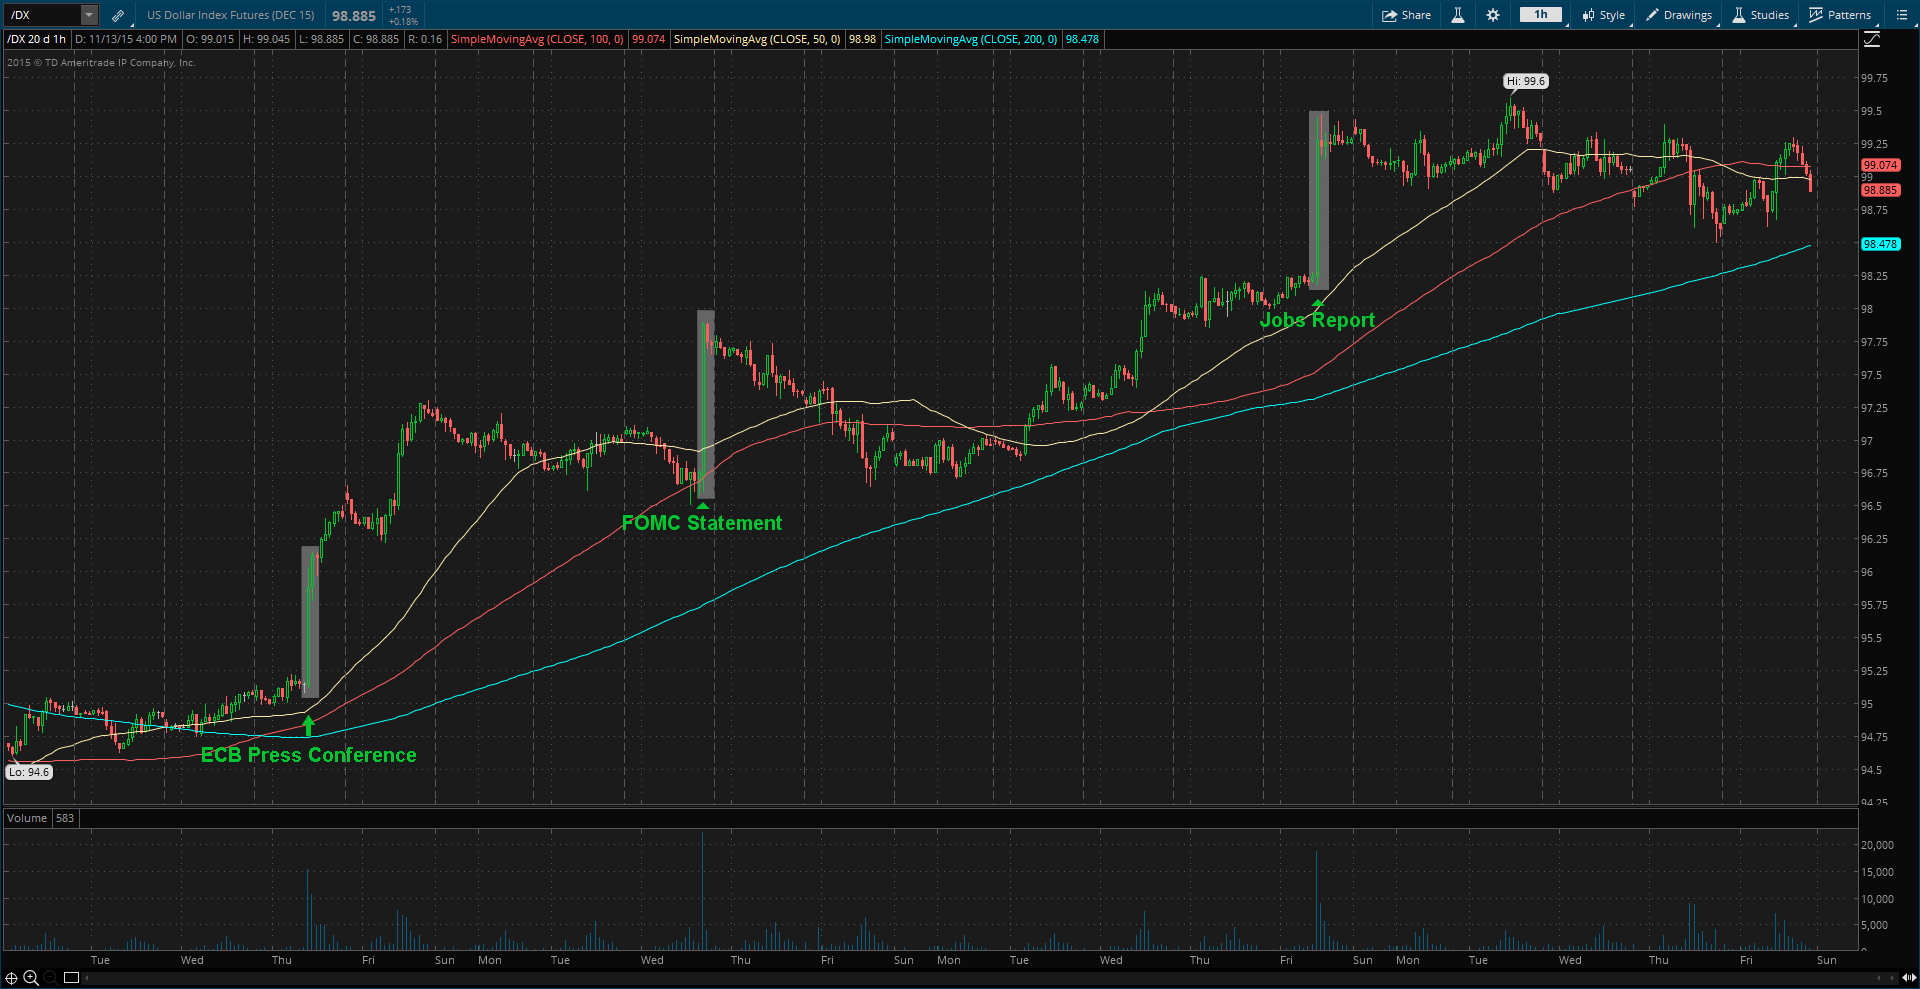
In March, the Fed expressed worries about the strength of the U.S. Dollar, just after the greenback hit above $100 mark. The greenback then tumbled and has never recovered back to $100….yet.

US Dollar ("/DX" on thinkorswim platform) - Daily
US Dollar (“/DX” on thinkorswim platform) – Daily

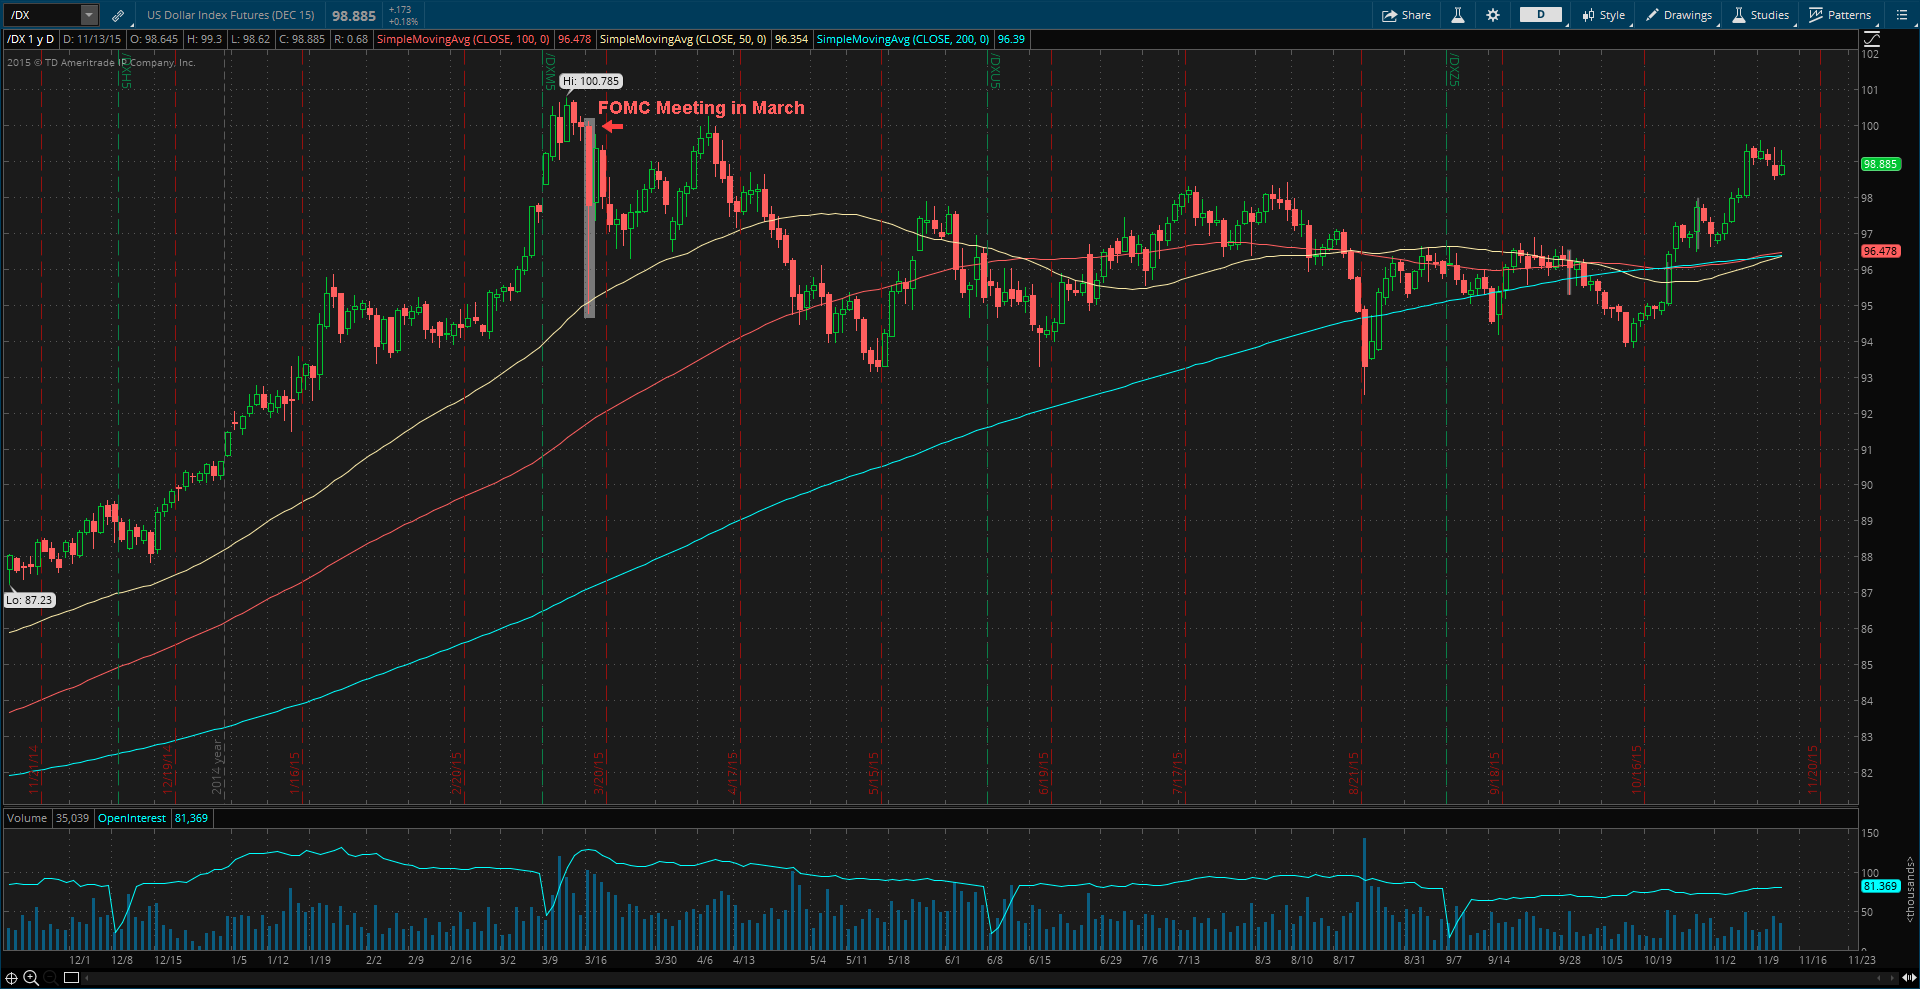
Right after the jobs report, the dollar skyrocketed and was 40 cents away from hitting $100 mark. It’s currently at $98.88 and there is a very high chance it will go above $100 until December 15, the first day of FOMC meeting.

If the November job numbers does not surprise to the upside (released in December 4), inflation stays low, and the dollar keeps strengthening, I do not believe the Fed will hit the “launch” button for a rate-hike liftoff.
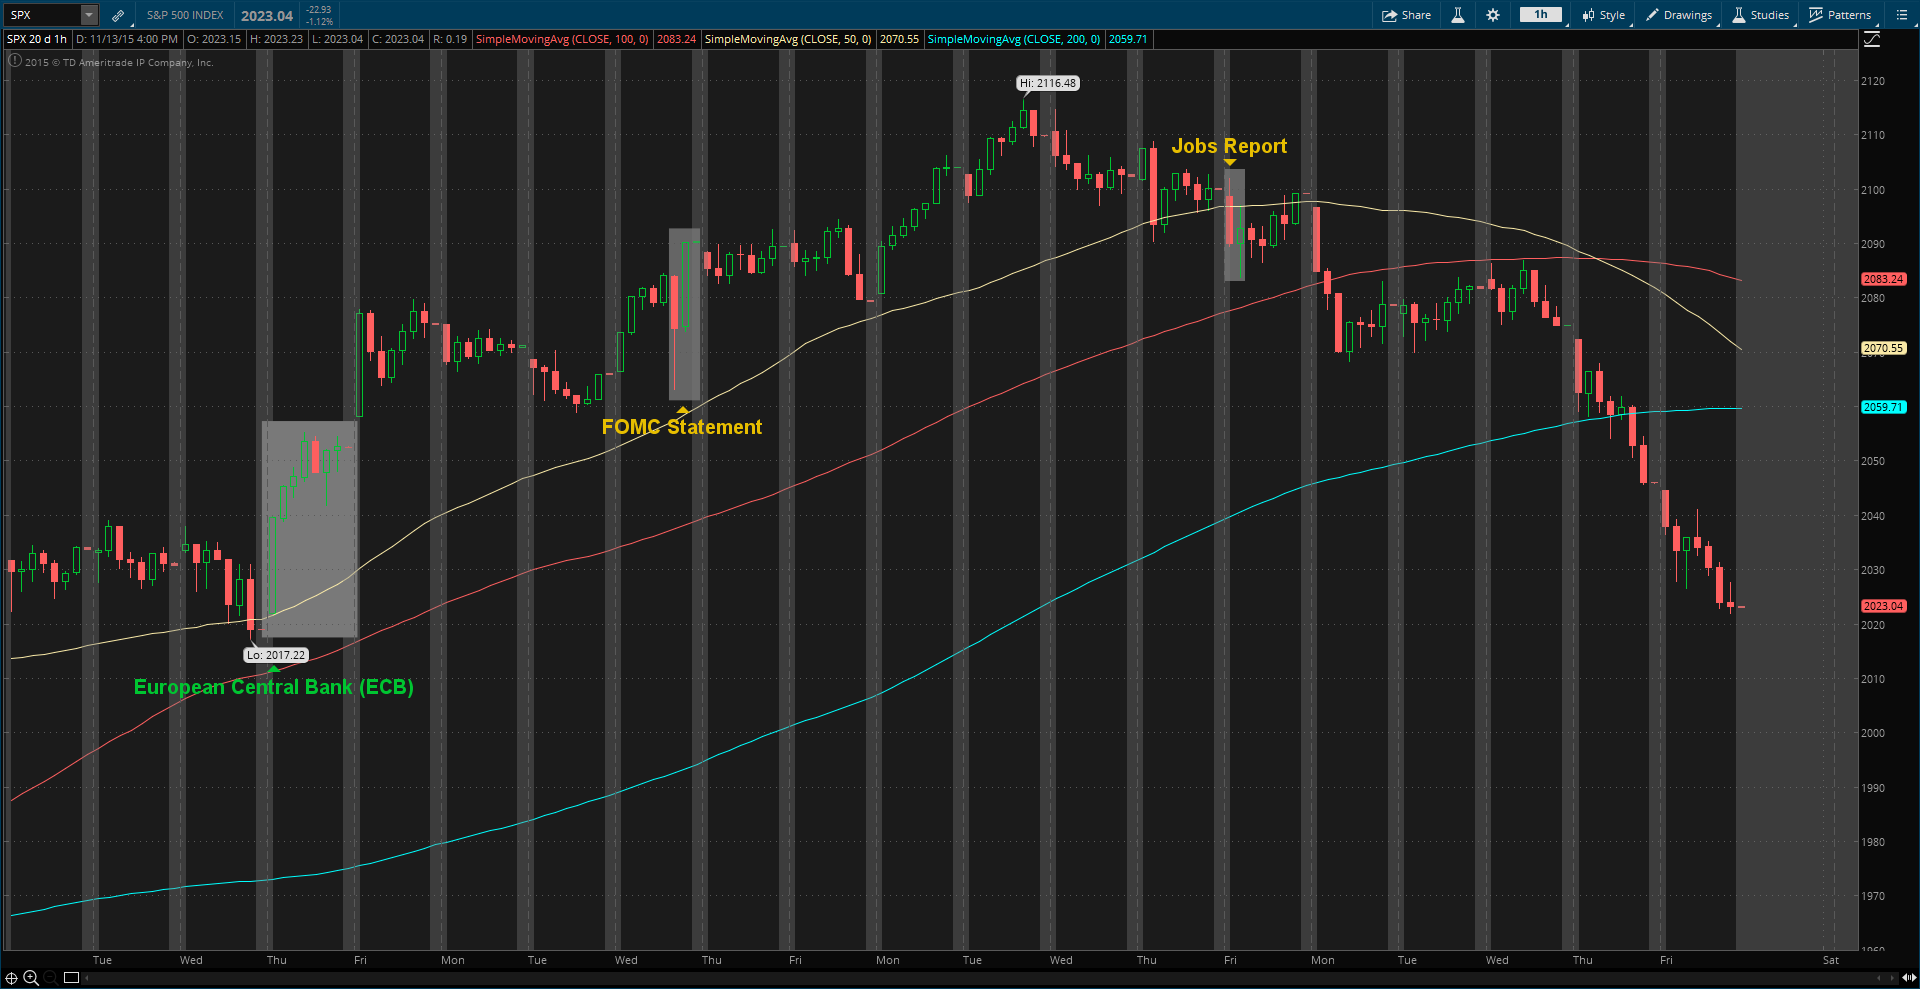
Market Reactions:

US Dollar ("/DX" on thinkorswim platform) - Hourly
US Dollar (“/DX” on thinkorswim platform) – Hourly
S&P 500 Index ("SPX" on thinkorswim platform) - Hourly
S&P 500 Index (“SPX” on thinkorswim platform) – Hourly

Fed Will Hike The Rates By…(Hint: Not 0.25%)

Last Friday (September 4, 2015), non-farm payrolls AKA jobs report for August came out little bit stronger. 173,000 jobs were added in August and the unemployment rate decreased by 0.2% (5.3% in July) to 5.1% (The Fed considers unemployment rate of 5.0% to 5.2% as “full employment”), lowest since April 2008.

Employments numbers for June and July were revised higher. June was revised from 231K to 245K (+14K) and July was revised from 215K to 245K (+30K). With these revisions, employments gains in June and July were 44K higher than previously reported.

Total Non-Farm Payrolls - Monthly Net Change
Total Non-Farm Payrolls – Monthly Net Change

Average hourly earnings increased 8 cents or 0.32% (biggest rise in 7 months) to $25.09, a 2.2% gain from a year ago. The average work week increased 0.1 hour, to 34.6 hours. Increasing income will lead to increased spending (demand increases) which leads to increase in Consumer Price Index (CPI) (As demand increases, suppliers will increase the prices of goods and services) which then leads to an increase in inflation, getting closer to Fed’s 2% inflation target (or inflation rockets to the moon, damaging the economy).

Lower oil prices may be holding back wage increases, especially in the energy sector.

While average hourly earnings are slowly growing, recent “positive” changes in the minimum wages – higher minimum wages – will not help earnings/income, but will only mutilate the US economy. While the minimum wage increases may sound like a good thing, but it isn’t. When businesses are forced to pay higher wages to their workers, they may have to increase prices for their goods/services, leading to increase in inflation. Some businesses might lose their market share to low-paying businesses aboard. After businesses adjust their prices to offset wage increases, there’s no actual change in the “buying power” of consumers.

It’s better to let US companies make their own decisions regarding wages. Let the markets lead. Laissez-Faire.

The labor force participation did not move at all, at 62.6% for a third straight month.

So, unemployment decreased and labor force participation stayed unchanged. Here’s the dark side:

261K Americans dropped out of the labor force, pushing total US workers who are not in the labor force to a record of 94 million. The government only counts people as unemployed if they are actively looking for jobs. Those who dropped out of the labor force are not actively looking for jobs. Therefore, real unemployment rate can be and is much higher.

This report was the latest jobs report before the Federal Reserve meets this month to answer “million-dollar” question, rate-hike or not? The Fed will meet on September 16 and 17 to decide whether to raise interest rates for the first time since June 2006.

Rate-hike in June 2015? Well, that did not happen. Rate-hike in September 2015? Well, expectations for the rate-hike were lowered due to uncertainty about China and the health of global economy. But, Yes, there will be a rate-hike this month. No, not 0.25% (or 25 basis points). The Fed will raise the rates by…

…10 basis points or 0.10%…

0.10% is very reasonable.

On August 27, Preliminary (2nd estimate) Gross Domestic Product (GDP) showed that the US economy grew faster than initially thought in the second quarter. GDP expanded at 3.7% annualized rate instead of the previous estimate (advance estimate) of 2.3%.

This clearly shows a sharp acceleration in US economic growth momentum following a weak start in the year.

Personal Consumption Expenditures (PCE) (Consumer spending), which accounts for two-thirds of US economic activity, grew at a 3.1% in the second quarter following 1.8% growth in first quarter.

Real GDP and PCE- Quarterly % Change (2012 Q1 - 2015 Q2)
Real GDP and PCE- Quarterly % Change (2012 Q1 – 2015 Q2)

PCE price index (inflation measurement) increased at 2.2% annualized rate after declining by -1.9% in the first quarter. Core-PCE (excluding food and energy) increased at 1.8% annualized rate after increasing only 1.0% in the first quarter.

Further revisions for the second quarter are possible when the Department Of Commerce releases its final (third) GDP update on September 25.

Market reactions to the economic reports:

S&P 500 ("SPX") - 15 Min. Chart
S&P 500 (“SPX”) – 15 Min. Chart
US Dollar ("/DX") - Hourly Chart
US Dollar (“/DX”) – Hourly Chart

Jobs Report Surprises To The Upside – IMF Wrong? (You Decide)

Last Friday (May 5, 2015), Bureau of Labor Statistics released non-farm payrolls (jobs report) for May and it was way beyond expectations. 280,000 jobs were added in May (largest since December) vs. expectations around 225,000. It’s a strong sign that the US economy is recovering from the contraction that occurred in first quarter of 2015 (January-March).

Total Non-Farm Payrolls - Monthly Net Change (June 7, 2015)
Total Non-Farm Payrolls – Monthly Net Change – 2014-Present


The unemployment rate ticked higher by 0.1% to 5.5% from 5.4%, as more people are entering labor force (because their confidence in the jobs market are increasing). In May, 397,000 people entered labor force, mostly recent college graduates.

Average hourly earnings increased 0.3% on month-to-month basis from 0.1% in April. Over the year, it increased 2.3%, largest rise since August 2013. It’s indication that future consumer spending will increase. When consumers spend more money, companies generate more money and eventually hire more people. Basically, it’s a short-term demand in the economy.

March and April numbers were revised. March was revised from 85,000 to 119,000 (+34,000) and April revised from 223,000 to 221,000 (-2,000).

There were big increases in employment in professional and business services (+63,000), leisure and hospitality (+57,000), and healthcare (+47,000). Meanwhile, employment in mining fell for the fifth month in a row (-17,000) as low energy prices continues to hurt energy companies.

This is the most important US economic report because it shows how first quarter, which contracted 0.7%, are due to transitory factors and guides the Federal Reserve on the path of raising the interest rates. As a result of strong jobs report, June rate-hike door is not closed. Federal Open Market Committee (FOMC) will be meeting on Tuesday, June 16, and Wednesday, June 17. At 2 PM EST, economic projections, statement and federal funds rate will be released followed by 2:30 PM EST press conference. The markets will be extremely violent during the time because it’s highly watched by investors and traders.

After the release of the report, US Dollar (USD) rose. USD against JPY (Yen) soared to a new 13-year high. US markets were mixed as investors/traders differently interpret what the jobs reports means for the future.


S&P 500 Index (SPX) - Hourly
S&P 500 Index (SPX) – Hourly
USD/JPY - Hourly
USD/JPY – Hourly


The day before the jobs report, the International Monetary Fund (IMF) slashed its forecasts for US economic growth and called for the Fed to hold off its first rate increase until the first half of 2016. The IMF said a series of negative shocks, including unfavorable weather, a sharp contraction in oil sector investment, the West Coast port strike, and the effects of the stronger dollar, hindered the first quarter of 2015. Thus, it promoted a downgrade to its growth expectations to 2.5% for this year, from 3.1% in April.

Economic Forecasts Souce: http://www.imf.org/external/np/ms/2015/060415.htm
Economic Forecasts
Souce: http://www.imf.org/external/np/ms/2015/060415.htm

IMF says that FOMC should remain data dependent and act after signs of a pickup in wages and inflation. Well, the jobs report for May was positive, including wages. So is IMF wrong? Did they talk too early? You decide.

In IMF’s view, “raising rates too soon could trigger a greater-than-expected tightening of financial conditions or a bout of financial instability, causing the economy to stall. This would likely force the Fed to reverse direction, moving rates back down toward zero with potential costs to credibility.” —- “raising rates too late could cause an acceleration of inflation above the Fed’s 2 percent medium-term objective with monetary policy left having to play catch-up. This could require a more rapid path upward for policy rates with unforeseen consequences, including for financial stability.”

So when is the right time to raise rates? I believe it’s in July or September (no meeting in August) only if we continue to see pickup in wages, employment, and Consumer Price Index (CPI). Even through the chance of rate hike in June is very low, I would not be surprised if Fed decides to hike rates. Even if they do, it will be surprising to most people at Wall Street and markets will definitely be violent – I would consider it “mini-SNB” (SNB – Swiss National Bank), because of SNB’s action in January (unscheduled release – removing the cap on euro-franc).

Feel free to contact me by going to “Contact Me” above or leave your comments below. Twitter: @Khojinur30. Thank you.


Recap: Europe, Australia, United Kingdom, Canada, and The United States.

This week was full of financial news. I will be talking about some of them, which I consider too important to pass up. I will also give my views on them.

Europe:

Last Monday (March 2, 2015), a report showed that Consumer Price Index (CPI) Flash Estimate ticked up to -0.3% year-over-year from previous -0.6%. Markets were expecting -0.4. The data was little positive. However, It remained in negative territory for the third consecutive month. There are deflation in euro zone. The deflation might soon end later in the mid-year, as Quantitative Easing (QE) program starts this Monday (March 9, 2015).

Last Thursday (March 5, 2015), European Central Bank (ECB) kept the interest rates unchanged. During the press conference, the President of ECB, Draghi stated that the QE would start on March 9. ECB raised its projections for the euro area, “which foresee annual real GDP increasing by 1.5% in 2015, 1.9% in 2016 and 2.1% in 2017.” Remember that these are just projections and can change anytime. Plus, central banks are not right all the time. Mr. Draghi felt confident as he talked about the future of Euro zone. He believes Euro zone will greatly benefit from QE program and some areas already have since the announcement of QE last January.

This week, EUR/USD fell all the way to 1.0838, lowest level since September 2003, due to positive U.S jobs reports, Greece worries and QE program starting next week. I was already short on EUR/USD and I still believe it has a room to go further down.

EUR/USD Hourly
EUR/USD – Hourly

Australia: 

Last Monday (March 2, 2015), Reserve Bank of Australia (RBA) announced that they will leave the interest rate unchanged at 2.25%. In February meeting, RBA cut by 0.25%. This time, they did not. RBA is in “wait and see” mode, for now. I believe another rate cut is coming in the two meetings, depending on future economic reports. In the Monetary Policy Decision statement by RBA Governor, Glenn Stevens stated that the Australian dollar “remains above most estimates of its fundamental value…A lower exchange rate is likely to be needed to achieve balanced growth in the economy…Further easing of policy may be appropriate…”.  I believe RBA is open to further cuts and it will come in the next two meetings. However, positive economic reports might change that direction. As economics reports come out from Australia, we will have better sense of what RBA might do.

Last Monday (March 2, 2015), Building Approvals report came out and it was very positive. It was expected at -1.8%. It came out at whooping 7.9% up 10.7% from previous -2.8%. It shows that more buildings are being built. Thus, creating jobs. However, Building Approvals reports show that building approvals tend to jump around every month. If the report continues to be positive, it might convince RBA to keep the rate unchanged.

Last Tuesday (March 3, 2015), Gross Domestic Product (GDP) came at 0.5%, up only 0.1% from previous report (0.4%). It came out little bit weak from what was expected, 0.7%. It’s still very weak and it might have larger impact on RBA’s future actions. I believe RBA will cut because GDP is not improving much.

Last Wednesday (March 4, 2015), Retail Sales and Trade Balance reports came out from Australia. Retail sales came out at 0.4% as expected from previous 0.2%.  Trade balance on goods and services were a deficit of $980 million, an increase of $480 million from December 2014 ($500 million). All these numbers are in seasonally adjusted term. I believe the gap in Trade Balance from the last two reports might convince RBA little bit to cut the rate again.

I would be short on AUD. I believe it has the potential to go further down to 0.7500. The best pair would be to short AUD/USD (Positive U.S news and upcoming rate hike).

AUD/USD Hourly
AUD/USD – Hourly

United Kingdom: 

Last Thursday, Bank of England (BoE) kept the interest rate unchanged at 0.50% and Quantitative Easing (QE) programme at £375bn. In March 2009, the BoE’s Monetary Policy Committee (MPC) unanimously voted to cut the interest rate to 0.50% from 1.00% (-.50%). The interest rate still stays unchanged and QE stays steady, for now. If future economic reports such as wages, and inflation declines or comes out negative, rate cut might come. If it does not, rate hike might come sooner than expected. I believe it will get better and MPC will decide to raise the rate, sending Pound (GBP) higher.

This week, Pound (GBP) fell after rising last week, due to little negative news from UK and that BoE rejected higher rate for some time being because of concerns in oil prices and inflation. I would not trade GBP at this time. If I’m going to trade GBP, I would analyze its chart first. Did you notice that last week GBP/USD had-daily bearish engulfing pattern and this week there is-weekly bearish engulfing pattern?

GBP/USD - Daily
GBP/USD – Daily
GBP/USD - Weekly
GBP/USD – Weekly

Canada:

Last Tuesday (March 3, 2015), Canadian Gross Domestic Product (GDP) came out little positive at 0.3% from previous -0.2% on monthly basis. It was expected at 0.2%. On quarterly basis, it came out at 0.6% following 0.8% in third quarter.

Last Wednesday (March 4, 2015), Bank of Canada (BoC) left the interest rate unchanged at 0.75% following 0.25% cut last month. Ever since BoC cut the rate last month due to falling oil prices; oil prices has risen and been in $50 range. If oil price continue to fall, I believe they will cut the rate again. There is strong relationship between Canada and oil. As oil gets weaker, Loonie (CAD) gets weaker. Why? Canada is ranked 3rd globally in proved oil reserves. When making a trade decision on CAD, I would look at the oil prices. Of course, I would also look at news and technical. For example, if I want to trade USD/CAD, I would look at both U.S and Canada economic news (rate hike/cut, employment, etc) and technical on chart. If U.S economic news are strong, Canada economic news are weak and USD/CAD is just above strong support line, I would definitely go long on it. However, let’s say if USD/CAD is just below strong resistance line, I would wait for confirmation of a breakout and if the news are in my favor, I would go long.

Last Friday (March 6, 2015), Building Permits and Trade Balance reports were strongly negative. Building Permits came out at -12.9%, following 6.1% the previous month, expected of -4.2%. Trade balance on goods and services were a deficit of -2.5 billion, following -1.2 billion the previous month, expected of -0.9 billion. Both reports were negative, which sent CAD lower. At the same time, U.S non-farm payrolls came out strong, which sent USD higher. As a result, USD/CAD skyrocketed. The reports will definitely be on BoC committee’s mind. As of right now, I would be short on USD/CAD.

This week, USD/CAD was mixed as BoC kept the interest rate unchanged, after cutting it last month (negative for USD/CAD) and strong U.S jobs report (positive for USD/CAD). I would be short on it as I said in the last paragraph.

USD/CAD - Hourly
USD/CAD – Hourly

United States:

Last Friday (March 6, 2015), U.S jobs report came out very strong except the wages. Employment increased by 295,000 (Expected: 240k) and unemployment rate went down 0.2% to 5.5% (Expected: 5.6%). However, average hourly earning fell 0.1%, following 0.5% the previous month (Expected: 0.2%). But, that hourly wages part of the report did not stop U.S Dollar from rising. It was very positive for the U.S dollar because there is little higher chance of rate hike coming in the mid-year.

Since U.S economic news tends to have impact on global markets, here’s what happened; U.S Dollar rose, U.S stock fell, European stock rose, Euro dived, Gold prices fell and Treasury Yield jumped. EUR/USD fell to 1.0838, lowest level since September 2003. USD/JPY rose to 121.28, a two-month high.

So why did U.S stocks sold off? It sold off because of upcoming rate hike, which can be negative for equities, specifically for dividend stocks. As economy is getting better, it should help boost corporate profits. At the same time, strong dollar can hurt them. Rate hike can only make dollar even stronger.

In two weeks, the Fed will be meeting and I believe they might drop the “patient” in its March policy statement.

I would be long USD. The best pairs would be to short EUR/USD (Euro zone delfation, Greece crisis and QE program) and short NZD/USD (RBNZ keeps saying that NZD is too high and they will meeting next week, rate cut?) as I’m already short NZD/USD, and long USD/JPY (Upcoming U.S rate hike and extra stimulus BoJ might announce).

Dow Jones Industrial (DJI) - Hourly
Dow Jones Industrial (DJI) – Hourly
Nasdaq - Hourly
Nasdaq – Hourly
Standard & Poor 500 (S&P 500) - Hourly
Standard & Poor 500 (S&P 500) – Hourly
USD/JPY - Hourly
USD/JPY – Hourly
NZD/USD - Daily
NZD/USD – Daily

Follow my twitter account @Khojinur30 or just click twitter icon on the top right to be directed to my twitter account, for my views that are posted any time. Thank you.