
Happy New Year! I have no resolutions since every day is like a new year for me.
In 2017, I focused more on active equity/commodity portfolio than the other portfolios as I finally was able to trade free of commissions, found more opportunities there and had money saved up from off-book jobs.
WHAT A BORING YEAR…for the stock market. Sometimes, boring is good. S&P 500 was up 21.64%.
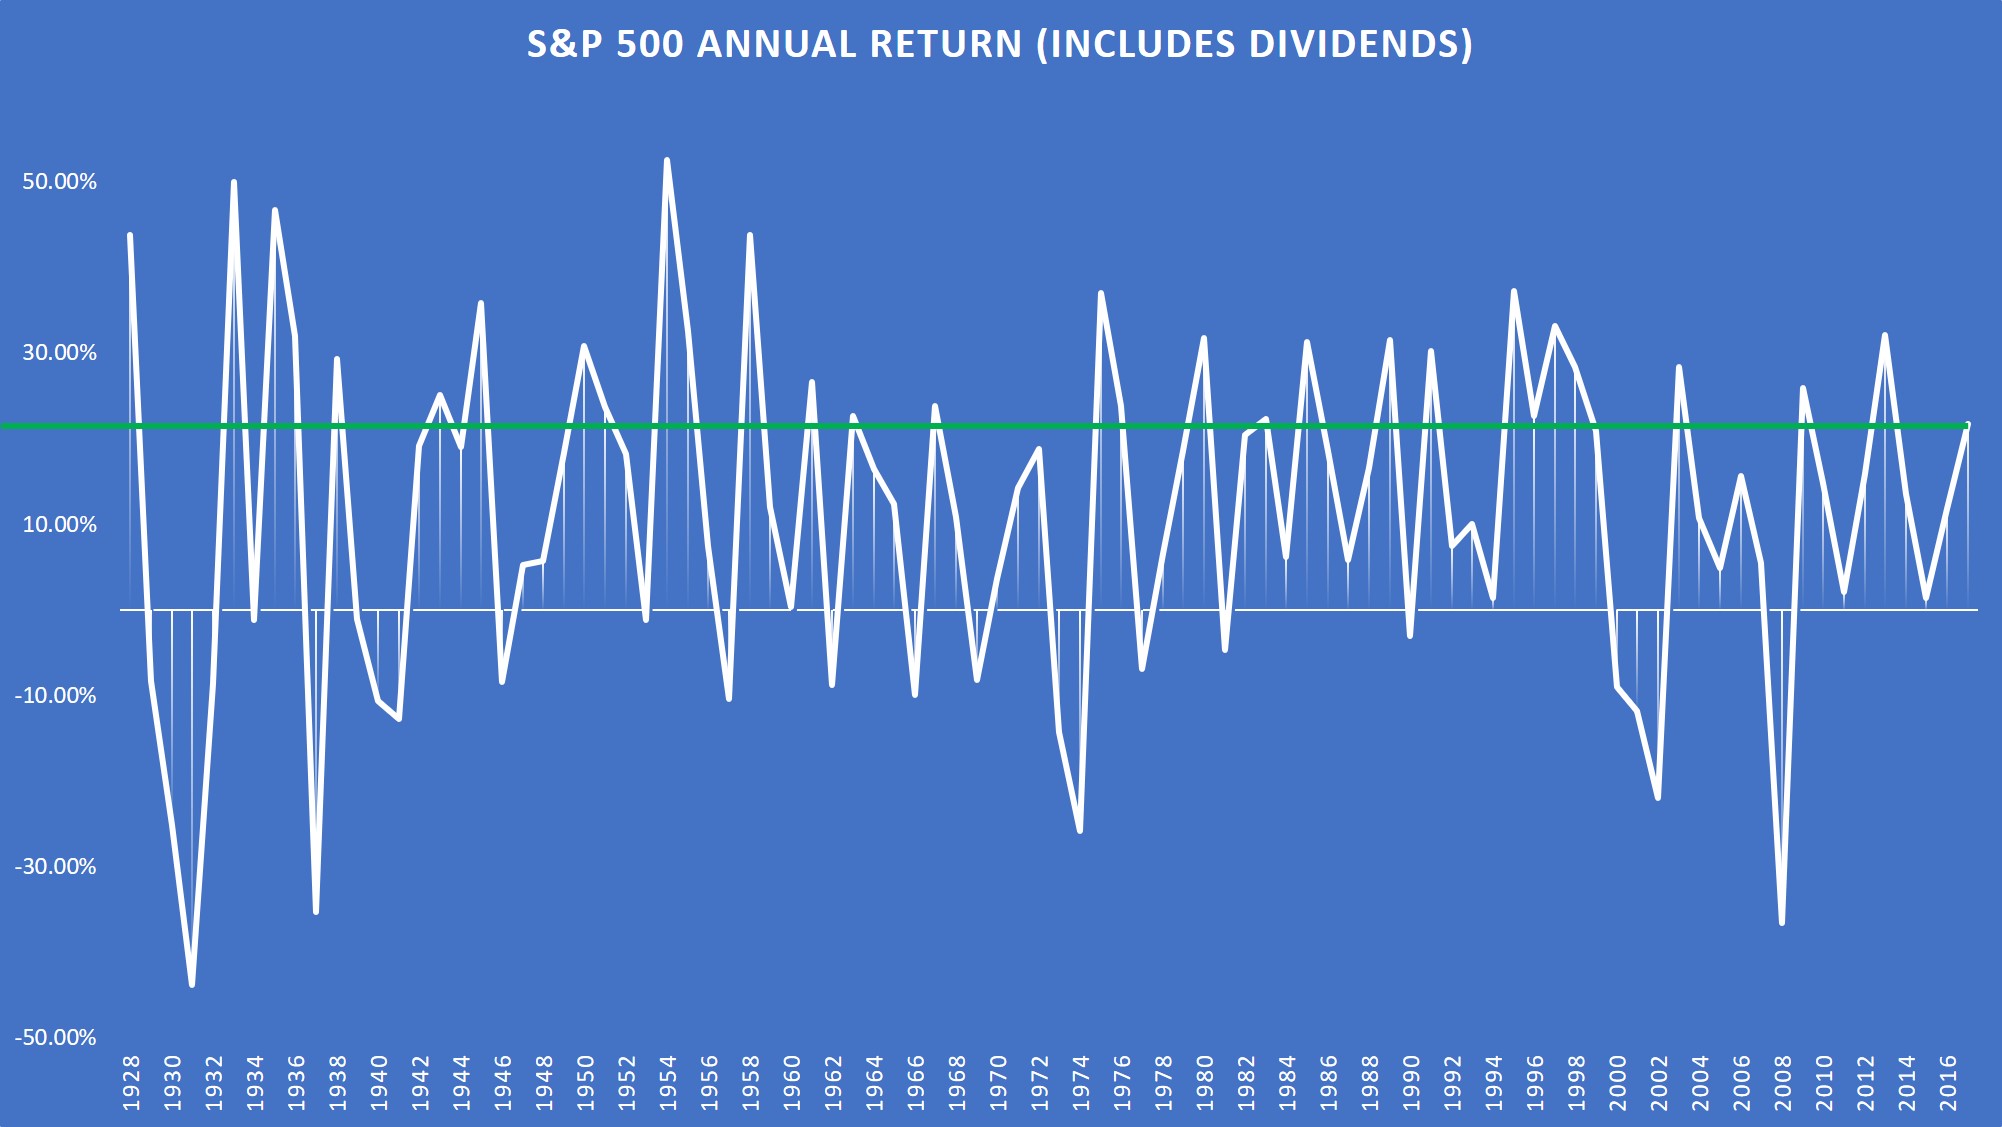
Source: Aswath Damodaran, NYU Stern
The geometric average return since the financial crisis is 8.42% (2008-2017). Geometric average better reflects the returns over time since there’s always volatility in the market and volatility lower investment returns.
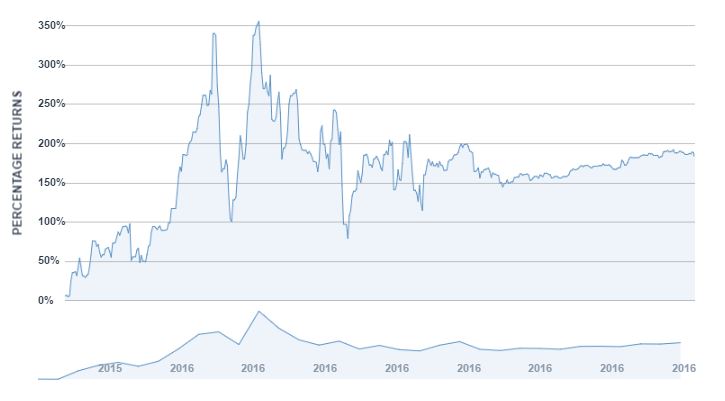
Since inception (November 2016), active equity/commodity portfolio is up 15.74%. For 2017, the portfolio returned 11.86%, way way below the market. No wonder active managers are not anyone’s favorites at this time.
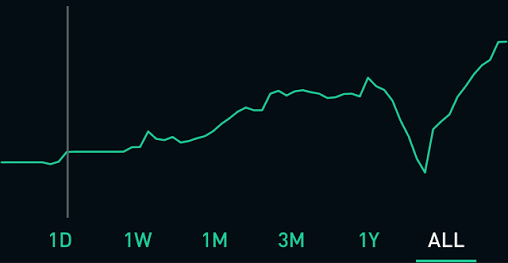
The white line represents the start of the year.
I will address the significant drawdown you see in figure 2 at the bottom of this post.
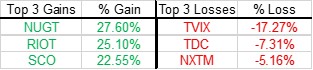
The biggest gain of the year, both in a percentage and nominal terms, came from the first trade in 2017. The trade was long NUGT (3x leveraged gold ETF). I believed gold was unfairly beaten down and would recover around the new year as portfolios would be rebalanced and uncertainty with Trump’s economic plans at the time would force investors to hedge their portfolio. And that’s what happened in January 2016. I closed the position at 28% gain.
While trading 3x leveraged ETFs, Be cautious as they always go down even though the underlying security goes up. The structure of leveraged and inverse ETFs are different than most retail investors think. They are not a good idea to be held for a longer time and as a significant portion of a portfolio.
The biggest loss of the year, both in a percentage and nominal terms, came from the 5th trade in 2017. The trade was long TVIX (2x leveraged volatility ETN, not ETF). I believed volatility would pick up from February to March (and it did a little bit). However, after TVIX underwent 1:10 reverse split in mid-March, I did not want to risk having the ETN go to single digits once again. So I closed the position at 17% loss.
To briefly sum up, the biggest gain was 28% and the biggest loss was 17%. In positive nominal terms, the profit was three times larger than the loss (positive number).
At the time, both NUGT and TVIX were a significant portion of the portfolio (Robinhood). Over time, I deposited more money into the account as I saved up from off-book jobs and summer internship. The account is now 6 times larger than it was at the beginning of 2017. Larger account allowed me to have more flexibility and lower my exposure to a single trade.
Current Positions:
I can only go long securities on Robinhood. Current positions are VRX (The biggest gainer at the moment, 112%. 14% of the portfolio), ORCL, XIV, ILMN, OMER, PSQ, SH, COL, TEVA, MTSI, and AXON (The biggest loser at the moment, -77%. 0.5% of the portfolio).
When talking about % gains on trades, traders should also look at those trades as a % of the portfolio. If I’m going to speculate on a one-time event, such as FDA ruling on a drug, I’m going to have a small exposure to that company (such as AXON). If I am profoundly convinced on the fundamentals of the company and/or technicals of the stock, I will have a higher exposure to that company (such as VRX).
It’s important to point once again these gains/losses are unrealized. The returns are subject to change…until the position closes.
Both PSQ and SH are inverse ETFs of the market. I have bought them as a small hedge for my portfolio as I’m long individual U.S. stocks.
Why am I long the stocks mentioned above? I will not go in-depth here.
- $VRX: Extension of debt. Time flexibility to restructure the company.
- $ORCL: Unfair share-price beat down after positive earnings report and market, in general, is trending higher.
- $XIV: Because why not?
- $ILMN: Someone is loading up big amounts of calls. Speculation it will be acquired at a huge premium.
- $OMER: Friend’s advice (first time I took friend’s advice with actual money at risk).
- $PSQ and $SH: Small hedge, as I mentioned above.
- $COL: Speculated it might be acquired at 15-25% premium. United Tech (UTX) later acquires them at 18% premium.
- $TEVA: TEVA calls were active after Allergan (AGN) was halted. Speculated upcoming positive news for TEVA. The week after, new CEO news. Sticking to TEVA as the new CEO has a great reputation and I’m confident his tenure will reward the shareholders.
- $MTSI: Calls active and social media sentiment.
- $AXON: Speculation on Alzheimer drug data. Chances were low, but I believed even a small positive side of the drug would help the stock price. I was wrong. Was initially 2% of the portfolio. Now 0.5%. Still open as I have nothing to lose.
Get Out?
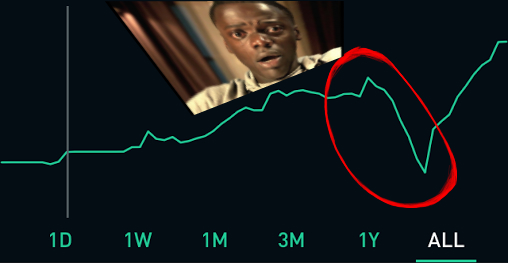
The face is from the movie “Get Out“
As you saw in figure 2 (and figure 3 below), there was a large drawdown in the portfolio. Over 12% of the portfolio lost value in less 2 months. Why was that? It was largely due to VRX and TEVA tumbling. Both were little longer-term strategy and high conviction both companies would turn itself around. After 2 months, both stocks rebounded and hit 52-week highs afterward. Other stocks in the port during the 2 months were performing fine.
If it is one thing I learned as a trader, it is that high conviction leads to an ego which then leads to losses most of the time. So did I have an ego in this case? I don’t believe so. I was sticking to the initial trade strategy on VRX and TEVA, and there was no material news. It was the market noise. If the company fundamentals changed, then I might have changed my strategy on the trade (either close, cut down, or buy more shares).
Upcoming ‘Portfolio Performance’ articles will be on other portfolios.