

Part 1 can be accessed by clicking here or https://www.outofwacc.com/cisco-systems-inc-nasdaq-csco-undervalued-part-1/
Before I go any further, let me tell you what led to Cisco in the first place. I strongly believe in technology and Internet of Things (loT). I believe the market will increase significantly as there are unlimited demand for it and will continue to have unlimited demand.
(Part 1)
Continued:
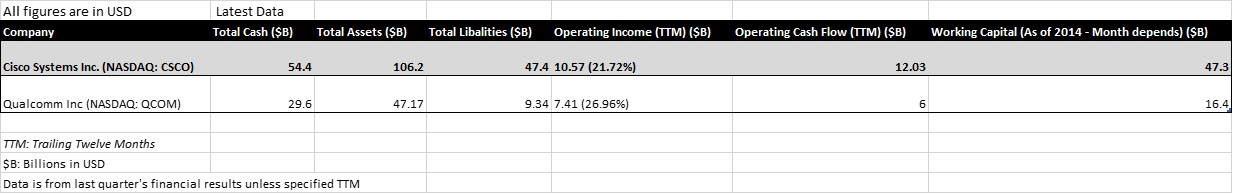
Cisco’s gross margin, operating income, operating cash flow, and total cash are strong and of course impressive.
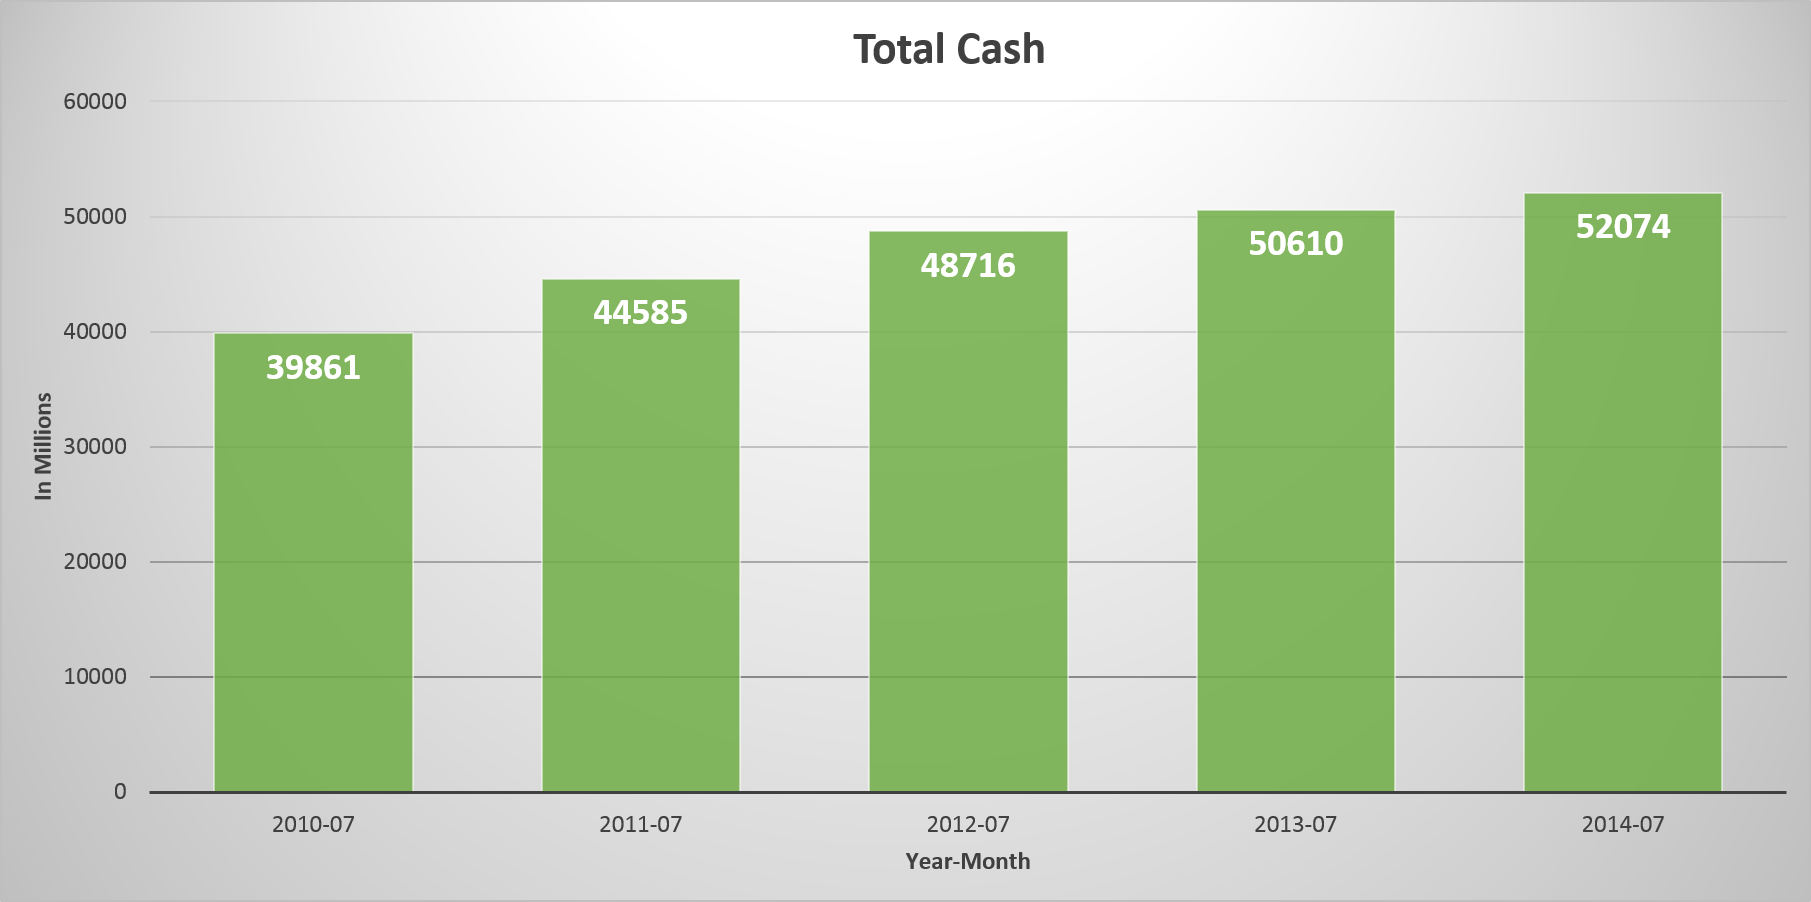
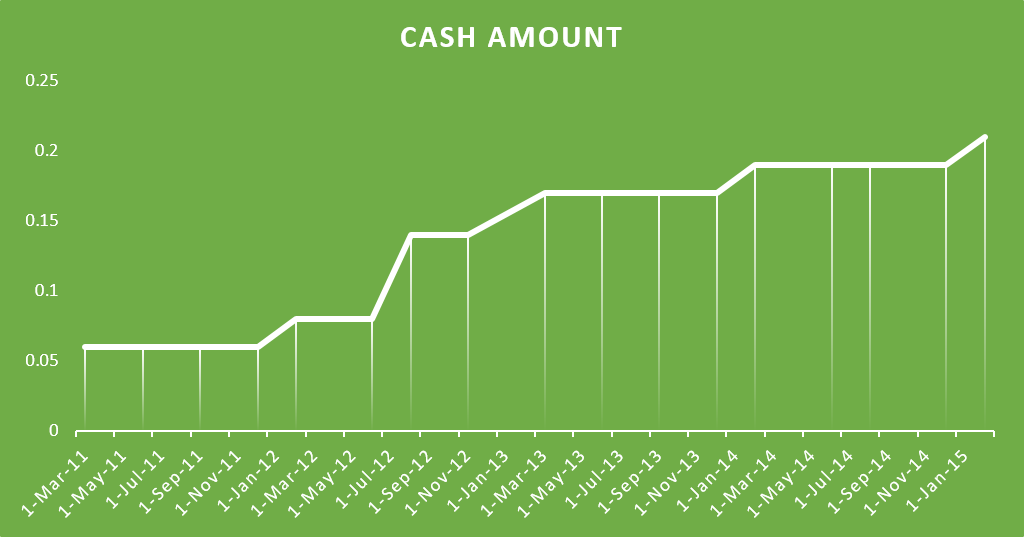
As of April 25, 2015, Cisco had almost $54.5 billion cash on hand. If you look at the “Total cash” chart below (Cash as of April 2015 not shown), you will see that Cisco had slightly over $52 billion cash as of July 2014. In a year, they managed to increase their cash about 5%. Over the last five years (2010-07 to 2015-04), they managed to increase their total cash amount by 36.25%. For company that’s so large and has a market capitalization of $136.9 billion, total cash appreciation is pretty impressive.
As of April 25, they had current assets of $69.4 and total assets of $106.2 billion. They have total liabilities of $47.4 billion. With strong amount of cash and assets, liabilities are not an issue and should not be in the future as the company continues to trim down liabilities.
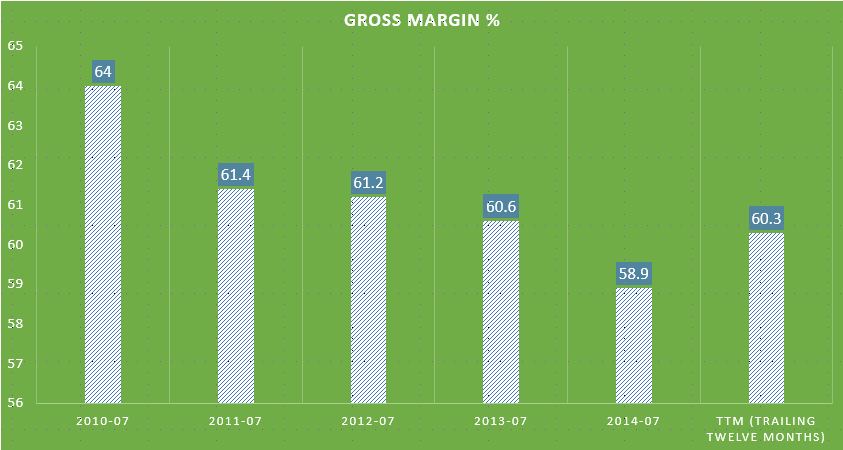
Gross Margin is very strong, although it has declined 3.7% in the last five years (see chart below)
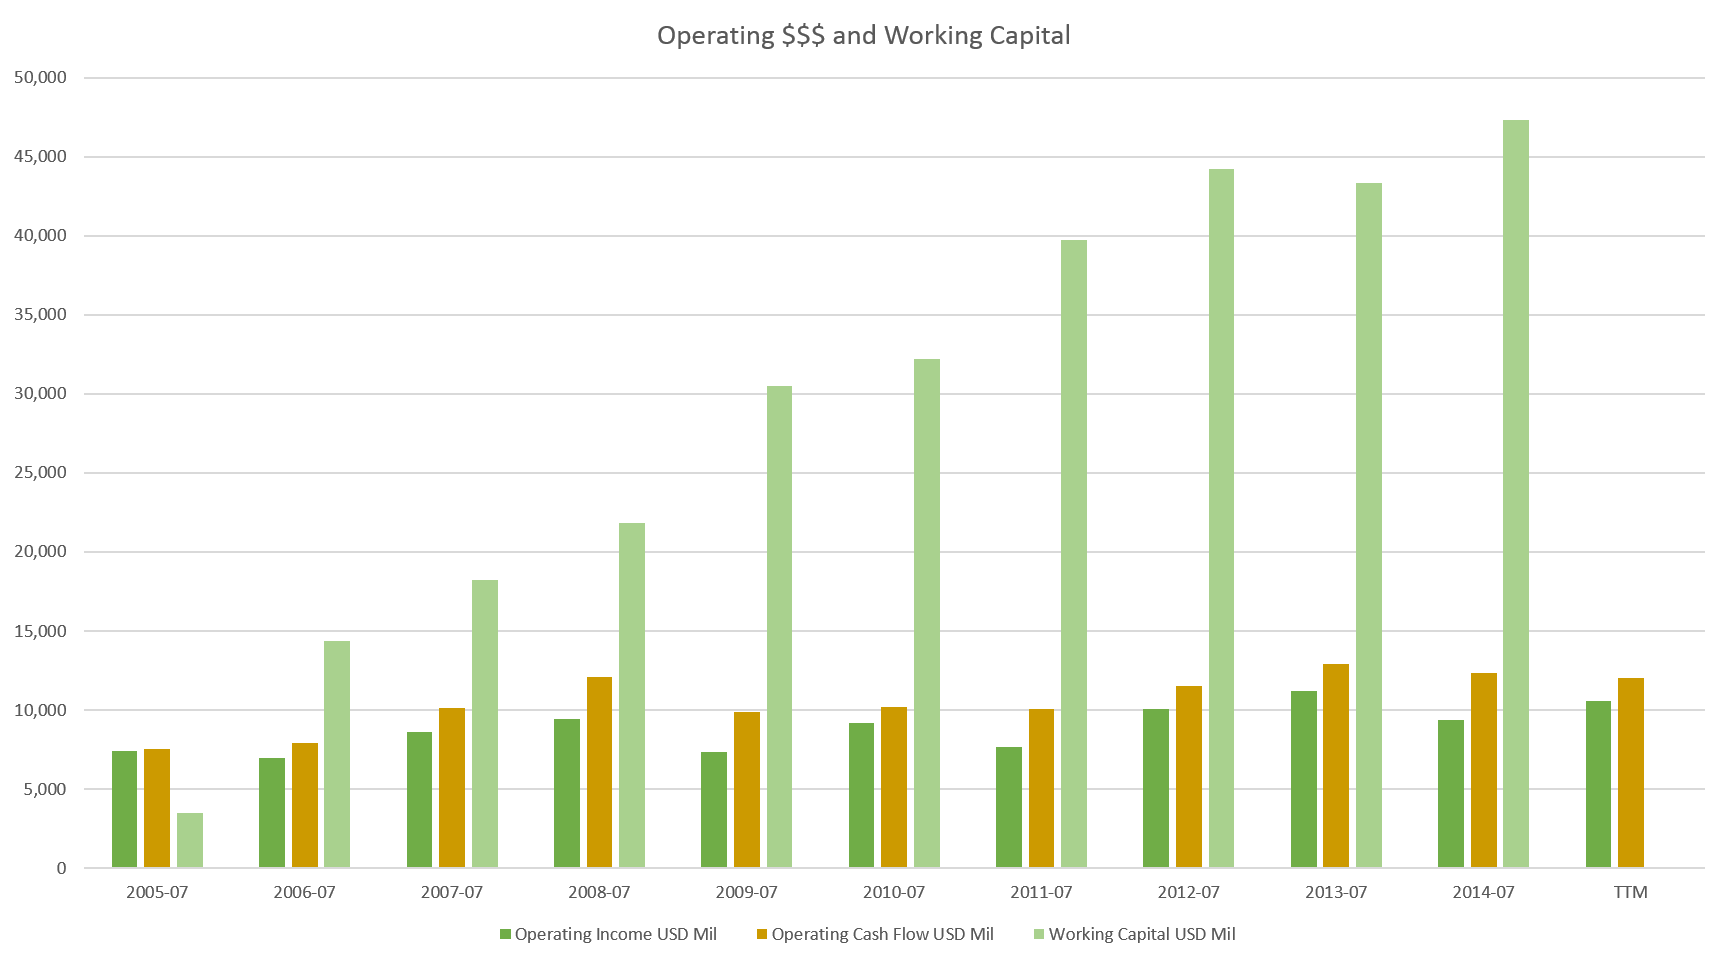
Over the 10 years, operating income has increased significantly while both operating cash flow and working capital has doubled. It shows that Cisco cares about longer-term success instead of focusing on short-term maximization. Long-term investors will benefit from the minds of the management.
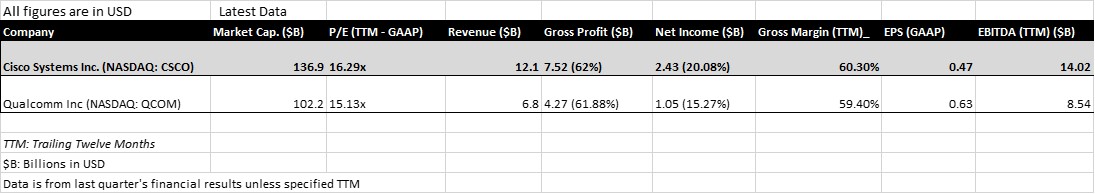
Comparable Company Analysis:
Below, you see a Comparable Company Analysis chart. I chose one major peer, Qualcomm. The reason I only chose Qualcomm is because all other peers such as Juniper Networks and Palo Alto Networks are too small.
Dividends and Stock Repurchase Program:
During the 3rd quarter of fiscal 2015, Cisco paid a dividend of $0.21 per share, or $1.1 billion. As of today, the divided is still the same. However, it’s expected to increase in the future. They pay a dividend of $0.84 annually, or 3% yield.
In the same quarter, Cisco repurchased approximately 35 million shares of common stock under the stock repurchase program for an aggregate purchase price of $1.0 billion. The remaining authorized amount for stock repurchases under the program is approximately $5.3 billion with no termination date. I believe they will issue new share buyback program after the current program ends, probably in about five quarters if they keep spending approximately $1.0 billion each quarter.
I love that Cisco is aggressively buying back stock. Not only that, but they pay divided to their shareholders which I expect to increase in the future.
Conclusion: From my analysis on Cisco, I have my stock price targets.
By 3rd quarter of fiscal 2016: Net income from 3Q fiscal 2014 to 3Q fiscal 2015 grew 11.74%. Let’s assume, it grows 5% from 3Q fiscal 2015 to 3Q fiscal 2016, net income would be $2,558.85 (in $billions), or GAAP EPS of $0.50 ($0.4971 to be exact). It would be $0.03 EPS increase year-over-year. When Cisco buys back shares, EPS will be higher depending on the amounts of shares purchased back.
Now, let’s assume GAAP EPS for the next 3 quarters stayed the same as 3Q fiscal 2015 which is at $0.47. After the 3Q fiscal 2016, Cisco would have EPS (TTM) of $1.91. At the current share price, the P/E ratio would then be 14.82x. But at this rate of growth, $CSCO would be worth $32, 13% higher than current price ($28.32), at P/E ratio of 16.75x, just 2.82% higher than the current P/E ratio of 16.29x.
My target price might change when Cisco reports 4Q fiscal 2015 earnings on August 12, 2015. I expect better than expected results. US Dollar (greenback) strength might hurt foreign sales. About 40% of their sales are aboard.
Disclosure: I’m currently long on the stock, CSCO. I went long last year at price just below $25. I will continue to be long.
Note: All information I used here such as revenue, gross margin, etc are found from Cisco’s official investor relations site, Bloomberg terminal and morningstar. The pictures you see here are my own.
Disclaimer: The posts are not a recommendation to buy or sell any stocks, currencies, etc mentioned. They are solely my personal opinions. Every investor/trader must do his/her own due diligence before making any investment/trading decision.